Gold And Silver Prices Find Support; For The S&P500, Abort! Abort!


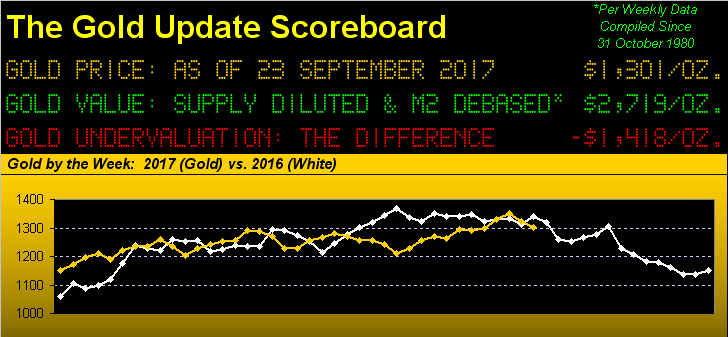
Gold and silver both have reached down precisely to their respective areas of "price bunching" support: for the yellow metal that's 1300, price settling out the week yesterday (Friday) at 1300.5; for the white metal that's 17.00, the week's settle there being 17.03.
To wit, let's start straight-away with the daily bars for both metals from three months ago-to-date. Note the zones of green-coloured bars for gold on the left and for silver on the right: those are the "price bunching" targeted support areas to where over the past two weeks we've been cautioning the precious metals could fall; now we hope that is all:
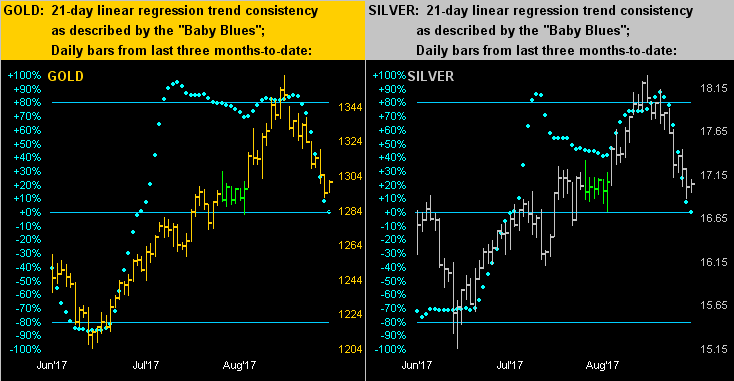
The good news is that both metals firmed into week's end right 'round those respective "price bunching" areas of 1300 for gold and 17.00 for Silver. The bad news is that the "Baby Blues" of linear regression trend consistency have only dropped half-way down both panels, suggestive of still lower prices. We've thus got ourselves a skirmish, folks: the "price bunching" support offered by the green bars vs. the downside mo-mo of those thinkin' "Oh, No!" Our take is that the metals shall consolidate through here, even should the blue dots first fall further away, prices then turning back up -- and specific to gold -- keeping Base Camp 1377 in play.
Indeed, let's next turn to gold's weekly bars. In last week's piece ("Gold's Pullback Appears Brief"), we stated: "this is as strong a weekly bars picture as we've seen in recent memory." Notwithstanding gold having since recorded a second consecutive down week, (prior to which price had risen in seven of nine), this graphic still reveals strength: the rising diagonal trend line has steepened, the parabolic Long trend continues to ascend, and further to the aforementioned "price bunching" support, we've also same within those otherwise "Whiny 1290s" as well as with the top of the purple-bounded 1280-1240 box. Add in some "safe-haven bid" on the threshold of it all going wrong for the stock market, and one can't help but love gold right here:

"So you really do think the stock market's finally had it, eh mmb?"
We've been thinkin' that for many-a-past year, Squire. And during that time we've seen many-a-"here comes the crash" headline only to find it all remain benign. But if ever the stars were perfectly aligned for the stock market as measured by the S&P 500 to go over the falls, to quote the late, great Inspecteur Clouseau: "Now is the time, Cato!" To wit these stats as compiled from our stuff:
■ September is historically a volatile month for the S&P: since 1970, this month's average trading range is 7.0%; true, we've still a week to run for this September, but that range thus far is a wee 2.5%, the narrowest across all 47 of those years! "Abort! Abort!"
■ The underlying S&P moneyflow has turned completely unsupportive of the Index: the S&P 500 (2502 at this writing) for the last 21 days is +58 points; however, its moneyflow as regressed into S&P points over the same time frame is -3 points. "Abort! Abort!"
■ For you hard-core technical types out there, our daily triumvirate measuring of the S&P using Bollinger Bands, Relative Strength and Stochastics has been triple-overbought for the last three trading days. The complacency crowd has on balance has ignored this rare event over the some 18 mutually-exclusive times 'tis occurred in the past 10 years, so go ahead, remain in the trance of your self-assurance. "Abort! Abort!"
■ Then there's this favourite measure of ours that no one really wants to calculate themselves for fear that the truth will hurt: the "live" price/earnings ratio for the S&P 500, (the summation of: each stock's current price, divided by its actual earnings, times its Index weighting; earningless stocks are conservatively accorded a P/E equal to their price). At this writing 'tis 42.5x, not the inane 17.7x "forward" P/E reported on CNBC last month. "Abort! Abort!"
■ And lest we forget, there's the in-yer-face truth provided by the Economic Barometer. "Abort! Abort!"
Or to improvise upon Rudyard Kipling's timeless poésie: "If you can keep your dough when all about you are losing theirs..." Nuff said.
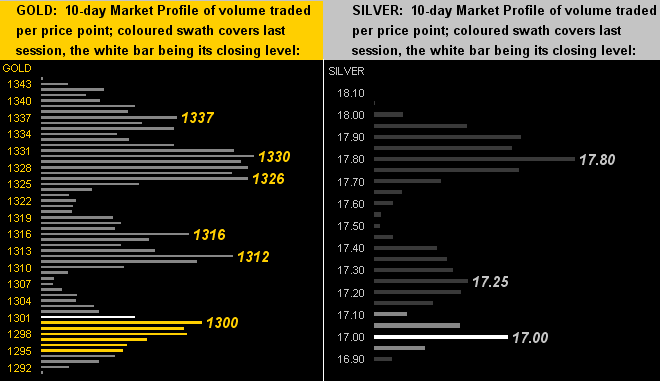
'Course, there's gold instead. And so on we go to the 10-day Market Profiles for the precious metals. At left for gold we see the 1300 "price-bunching" supporter and the attendant overhead resistors (as also are noted in the Gold Stack which follows). At right for Sister Silver we see her sitting smack on her 17.00 "price-bunching" supporter. Aided by what we anticipate shall be an unraveling of the S&P over the ensuing days, let's look as well for the precious metals to be higher up their Profiles in a week's time:
And thus without further ado, here is...
The Gold Stack
Gold's Value per Dollar Debasement, (from our opening "Scoreboard"): 2719
Gold’s All-Time High: 1923 (06 September 2011)
The Gateway to 2000: 1900+
Gold’s All-Time Closing High: 1900 (22 August 2011)
The Final Frontier: 1800-1900
The Northern Front: 1750-1800
On Maneuvers: 1579-1750
The Floor: 1466-1579
Le Sous-sol: Sub-1466
Base Camp: 1377
2017's High: 1362 (08 September)
10-Session “volume-weighted” average price magnet: 1319
Trading Resistance: 1312 / 1316 / 1326 / 1330 / 1337
Gold Currently: 1301, (expected daily trading range ["EDTR"]: 14 points)
Trading Support: 1300
10-Session directional range: down to 1291 (from 1345) = -54 points or -4%
Neverland: The Whiny 1290s
The Box: 1280-1240
The 300-Day Moving Average: 1261 and falling
The Weekly Parabolic Price to flip Short: 1231
2017's Low: 1147 (03 January)
"Uh mmb, before you sneak out the door, how far down do you see stocks going?"
Really, Squire, you know we never "sneak out the door"; rather, we move on to the next event, which in this case is addressing yours (and everyone else's) question. The S&P 500 (on a closing basis) has had two very short-lived 10% corrections in each of 2016 and 2015. At such lofty levels as we've today, especially given the vast dearth of earnings support, another 10% correction (which from 2502 would bring the Index down to 2252) would appear as nothing but noise. Moreover, to get back in line with earnings support, a better than 50% correction is appropriate.
But for the present, let's consider a correction of 20%, the last one of which occurred in 2011: 20% would bring the S&P down to 2002 (the level, not the year). That area makes sense for 'tis the centerpiece of structural support that ran from late 2014 into early 2016. But here's the more interesting bit: the S&P500 and gold have been in negative correlation 71% of the time since this date a year ago. So: were the S&P from here to drop 20% and Gold by inverse correlation rise 71% of that 20%, (i.e. 14%), we'd find the yellow metal at 1483. Yes, we first need price to get to Base Camp 1377 and consolidate above there. But 'tis always nice to see what's realistically up the road for gold!

Mark Mead Baillie has had an extensive business career beginning in banking and financial services for two years with Banque Nationale de Paris to corporate research for three years at Barclays Bank and then for six years as an analyst and corporate lender with Société Générale.
For the last 22 years he has expanded his financial expertise by creating his own financial services company, de Meadville International, which comprehensively follows his BEGOS complex of markets (Bond/Euro/Gold/Oil/S&P) and the trading of the futures therein. He is recognized within the financial community of demonstrating creative technical skills that surpass industry standards toward making highly informed market assessments and his work is featured in Merrill Lynch Wealth Management client presentations. He has adapted such skills into becoming the popular author each week of the prolific “The Gold Update” and is known in the financial website community as “mmb” and “deMeadville”.
Mr. Baillie holds a BS in Business from the University of Southern California and an MBA in Finance from Golden Gate University.


