Gold And Silver Prices Moving In Unison For A Massive Price Advance (Part 2)


As we continue to explore our custom research into the metals markets and our presumption that the metals markets are poised for a massive price rally over the next few months/years, we pick up this second part of our multi-part article illustrating our research work and conclusions. If you missed the first part of this article, please take a minute to review it by before continuing further.
We left off in Part I showing a number of supply and demand components and briefly highlighting our newest research using a custom Gold/Silver/US Dollar ratio index. Our attempt at finding anything new that could help us determine the future outcome of the metals markets and to either support or deny our future expectations that the metals markets are poised for a massive price advance was at stake. This new research would either help to confirm our analysis or completely blow it out of the water with new data. Let's continue where we left off and start by showing even more data related to our new custom metals ratio.
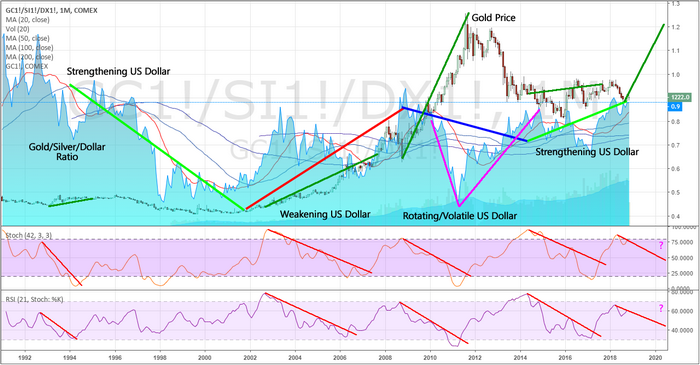
This Monthly chart showing our custom gold pricing ratio and the correlative price of gold illustrates a number of key features. If you remember from Part I, the current ratio level (the Blue Area chart) is near the top of the Upper Boundary level (0.80 or higher). Whenever the ratio level enters this Upper Boundary level, it typically only stays there briefly before falling towards the Lower Boundary level. We've highlighted what we believe to be key elements of this type of ratio/price reaction. On the chart, below, we've highlighted every major ratio level decline from near the Upper Boundary level and the associated reaction to the price of gold as well as the indicator reaction near the bottom of the chart. With each instance, we can clearly see that price advanced, in some cases dramatically, as the ratio level declined from the Upper Boundary towards the Lower Boundary. The biggest move occurred between 2002 and 2012 where two of these ratio rotations occurred.
Near the right edge of this chart, we can see that the ratio levels have already started to decline from recent peaks. We believe this could this be the start of a broader ratio level decrease that prompts a massive price rally in the metals markets. We believe this ratio swing could be accelerated by rotation and volatility within the US Dollar price and increased demand from Investors over the next 4~6 months.
Again, this Monthly chart paints a very big picture – planning many years in advance of this move. We believe this new metals market rally is setting up to be something that gold traders have been thinking about for decades – a potential of gold reaching $5000 or higher in a dramatic price rally that correlates with broader global market events. We don't know what those events are at the moment, but we could certainly guess as to the nature of their origination.
Our research supports our opinion that the metals markets are dramatically underpriced in relation to global risk and potential future events. The only thing, in our opinion, that could prevent a new price rally from forming over the next 6+ months is a continued malaise in investor sentiment or continued strength in the US Dollar. If either of these two components continues for any length of time, the price of gold and our custom ratio will likely continue to base near current levels or slightly lower.
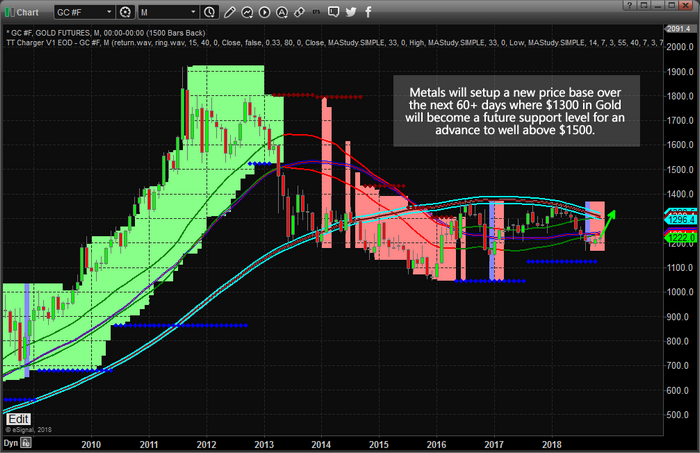
Our expectation is that currency issues as well as rotation or some weakness in the US Dollar will likely prompt an impulse rally in gold where prices rally above $1300 before April 2019 and form a price base for the rest of the expected rally. Once the conditions ripen within the market and investors begin to pile into the long gold trade, the ratio will reflect this move and demand from the investor side will drive prices higher with the expectation that some type of crisis event cycle is about to unfold.
This next Monthly gold chart shows what we believe will be the initial impulse move higher (towards and above $1300) before the rally really starts to gain speed. A rotation above $1300 would establish a new price base near or above recent highs and start the accumulation by Investors – driving the demand side of the equation. This move would also push the ratio a bit lower in support of our expectations.
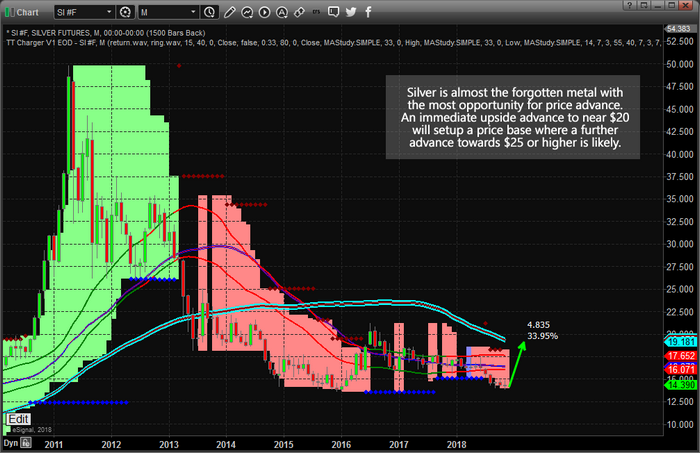
This Monthly silver chart clearly shows the extended opportunity for skilled investors ahead of this move. We believe silver is one of the most undervalued investments on the planet right now and that our analysis supports a longer-term view that silver could reach the $40 to $50 level very quickly if the events we suspect are unfolding actually do unfold as we are suggesting. This would equate to a 280%+ swing in price before an even bigger move higher unfolds.
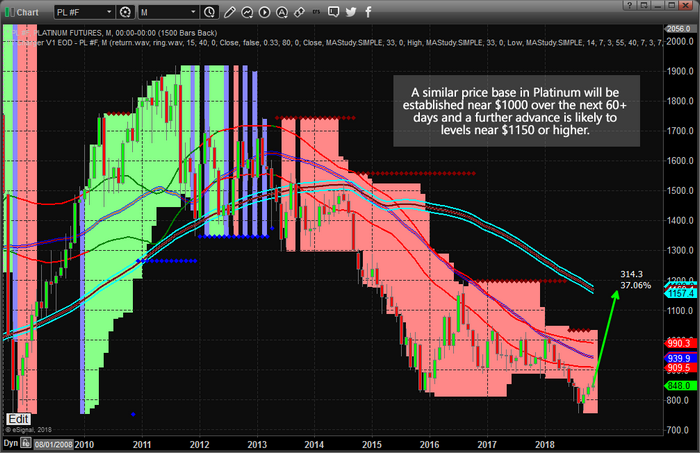
This Monthly Platinum chart shows the pricing pressures over the past 5+ years that have plagued the metals markets. If you were to take a look at the custom metals ratio chart near the top of this article, you would see that this pricing pressure is related to a number of key factors – most of which relate to lack of investor demand and lack of true price exploration (rotation of the ratio levels). In other words, price levels in the metals markets have been operating in a very narrow “void” or any real price rotation or exploration. We believe this environment is about to end and we believe the continued “price malaise” will end with a massive impulse move higher.
You can see from this chart we expect Platinum to rally to near $1150~1200 in the initial impulse move, then form a base before a further price advance.
In conclusion, if our longer-term analysis is correct and prices do begin to move higher with a shift in Investor sentiment and a renewed pricing advance supported by US Dollar or foreign currency weakness, our researchers believe $2456 and $3016 levels in gold could become prime upside price targets. To put that in relative terms, this would be a 200% to 246% price advance in gold. One could expect silver to advance to near $40 and $50 which would be a 278% to 348% price advance. Depending on the scope and scale of the event cycle that unfolds, these levels could be considered conservative targets for upward price moves.
Please keep in mind that this research post is very long-term in scope and expectations. This is not going to happen next week or even over a few weeks. This is going to be years in the making and it could change how you adapt your investment styles over the next few years. Our efforts to bring this advanced research to you is our attempt to alert you to a pattern that is unfolding in the metals markets that could provide you with a huge opportunity for future success. Once this pattern starts to unfold further, expect the global stock markets to start reacting to this new “fear element” and prepare to adjust your trading styles accordingly.
We believe you won't find a better team of researchers, traders and analysts than with www.TheTechnicalTraders.com. Our proprietary research, price modeling systems, and predictive analysis tools help to keep our members well ahead of the market with each turn.

Chris Vermeulen has been involved in the markets since 1997 and is the founder of Technical Traders Ltd. He is an internationally recognized technical analyst, trader, and is the author of the book: 7 Steps to Win With Logic
Through years of research, trading and helping individual traders around the world. He learned that many traders have great trading ideas, but they lack one thing, they struggle to execute trades in a systematic way for consistent results. Chris helps educate traders with a three-hour video course that can change your trading results for the better.
His mission is to help his clients boost their trading performance while reducing market exposure and portfolio volatility.
He is a regular speaker on HoweStreet.com, and the FinancialSurvivorNetwork radio shows. Chris was also featured on the cover of AmalgaTrader Magazine, and contributes articles to several financial hubs like MoneyShow.com.


