Gold And Silver Review


Arguments for lower prices
- 3-years downtrend: Overall Gold still is in a downtrend. US$1,525.00 remains the line in the sand. Gold will need much more time to break through this heavy resistance. Only a move above US$1,390.00 and especially US$1,430.00 will indicate that the mid- and longer-term trend indeed has changed.
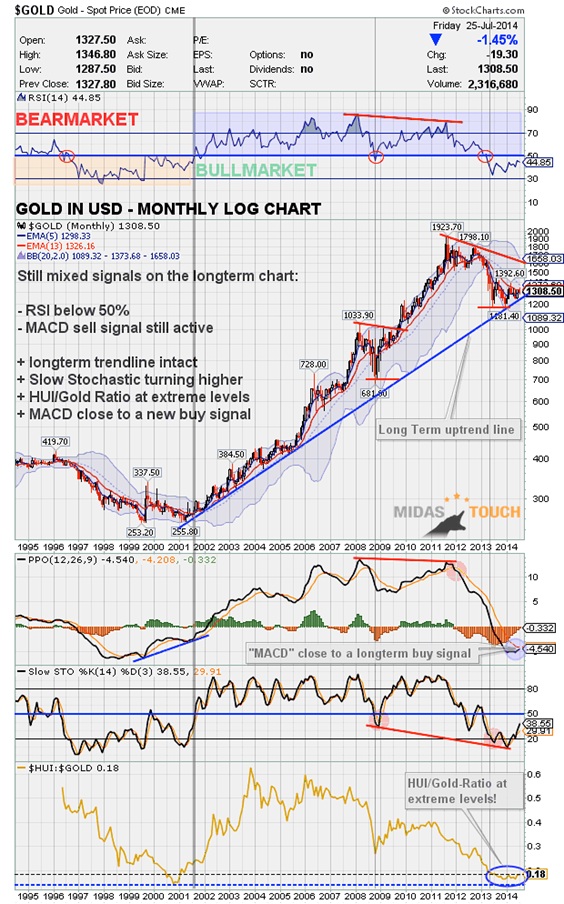
- Gold Monthly Chart: MACD sell signal active since November 2011 (this is extremely powerful and needs to change before one can really call the bottom). It looks like MACD could create a buy signal within the next 1-2 months. RSI still below 50 and in bear market territory.
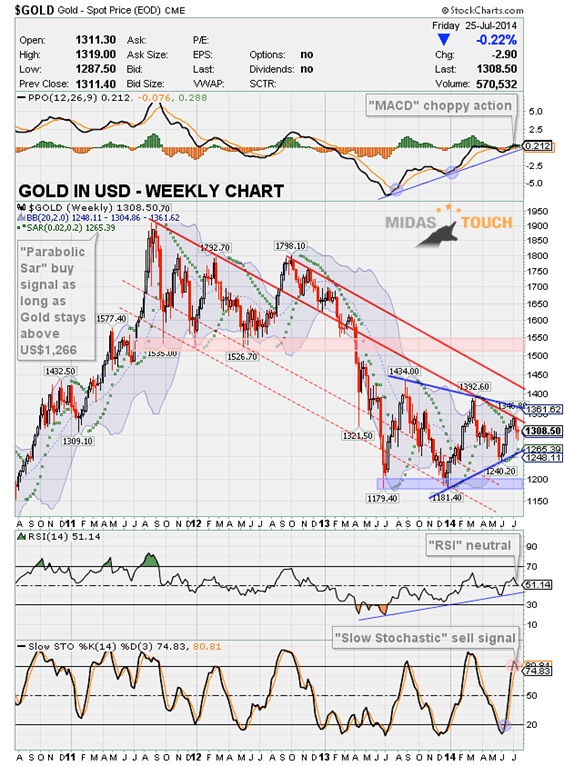
- Gold Weekly Chart: Gold failed to reach the blue triangle downtrend-line around US$1,365.00 during its latest advance. MACD is choppy while stochastic is in sell mode. Gold continues to move sideways and further into the blue triangle. No bullish indication yet. The chart remains basically neutral.
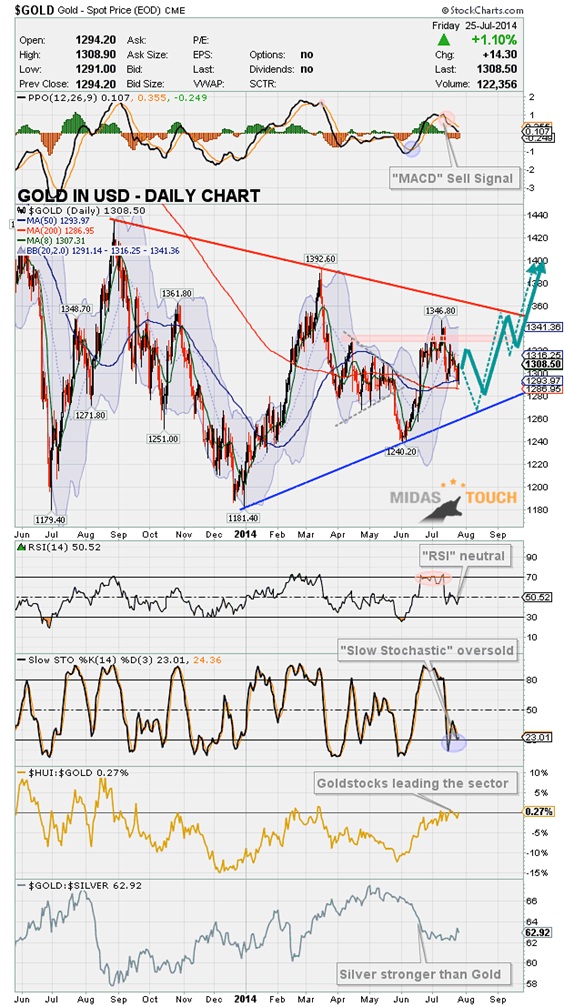
- Gold Daily Chart: Gold had a big sell off from the top at US$1,346.80 two weeks ago. The short-term trend is down besides any whipsaw action. MACD sell signal active.
- GLD: Still has an open gap around $122.70 to fill. This coincides with Gold correcting back to around US$1,280.00.
- Gold Stocks: HUI has an open gap to fill around 227 points. Short-term Gold Bugs sentiment has eased in recent days but still sitting at slightly extreme optimism levels (70%). As well MACD & Stochastic sell signals are active.
- CoT-Data: Commercial short position in Comex Gold Futures spiked up to 156,906 contracts last week and is sitting around this level. Although being still at low levels compared to other readings during this bull market this does not look very healthy. Many mining companies have increased their hedging due to difficult business environment, low Gold prices and high production costs. This is an important development to watch in the future. As well bullish bets on Silver have been at the highest levels in over three years.
- Physical demand: China´s Gold imports via Hong Kong reached a 17-month low in June. China´s Gold demand decreased by 20% in the first six months of 2014 while at the same time Chinese Gold production increased by 9%.
- US-Dollar: The dollar seems to be tracing out an inverted head & shoulder bottoming pattern. A rallying dollar will not be friendly to the metals.
- Stock-market: The retail money market ratio is at lowest levels since nearly 20 years showing that investors are fully committed to the markets. Same analysis for the Rydex Money Market %. When traders are so optimistic and sure of themselves that money market assets account for less than 40% of total assets, then it usually coincides with a market peak. The conclusion is that a deflationary crash might be looming which would not be good for precious metals in the beginning. Only after central bankers start flooding the market with even more liquidity the precious metals sector will outperform all other asst classes....
- Baltic Dry Index: At its lowest levels since 1986!
Arguments for higher prices
- Higher Low: The uptrend since the beginning of the year is still valid. The correction during spring did not reach a new low below last December’s US$1,180.00. Instead Gold turned higher from US$1,240.20. This is extremely positive because we now have a series of higher lows. The market will soon want to figure out if the lower high at US$1,395.00 (from march) is still valid.
- Gold Monthly log-Chart: Long-term trend-line is intact and now around US$1,255.00. Any move below US$1,250.00 is highly unlikely and would mean the end of this secular bull market! As well MACD is about to create a powerful long-term buy signal.
- Gold Weekly Chart: Since May 2013 Gold is moving sideways between US$1,180.00 and US$1,434.00. The current blue triangle should break within the next 1-3 months. Resistance at US$1,360.00 and solid support around US$1,265.00. The parabolic SAR indicator remains in buy mode until US$1,265.39 is taken out. Weekly lower Bollinger Band at US$1,248.11 will be strong support too.
- Gold Daily Chart: Gold bounced off the 200-MA (US$1.286,95) and the 50-MA (US$1,293.97). Both moving averages offer good support and running basically sideways. Slow Stochastic is oversold while RSI has been neutralized in the last two weeks. The huge sell off two weeks ago did not lead to a follow through. Also note that besides all the bearish talk the gold bears did not make any progress since more than one year!
- Gold/Silver Ratio: Currently at 62.92. Silver continues to be stronger than Gold. The ratio is consolidating since early july and is barely holding above an important uptrend-line. Any convincing close below 61.50 would confirm a new rally in the precious metals sector. Short-term it looks like it could continue to consolidate around its 200-MA (63.38).
- Gold-Stocks: According to www.goldstockanalyst.com Gold Stocks are 37% undervalued and trading as if Gold was at US$839.00.
- Sentiment: Short-term sentiment is bullish with Kitco´s weekly Gold survey counting 63.6% bears. Long-term sentiment for Gold still is close to excessive pessimism.
- Inflation: US-inflation officially at 2.1% leading to a current 10-year real interest rate at 0.25%. With many geopolitical risks in energy producing countries, oil and gas prices could quickly push inflation rate higher. As soon as real interest rates turn negative again Gold and especially Silver will start to sky rock.
- Seasonality: Best time of the year is starting now. After 3 years with heavy corrections in autumn I think this year we could see a sustainable rally into December. Statistically best months of the year are august, September and November.
- Euro CoT-Data: Commercials have been building up a massive long position. Sentiment is close to excessive pessimism. Therefore I do not expect the Euro to crash although the chart does not look very good. Instead combined with positive seasonality the Euro could surprise in the coming months. A weaker US-Dollar should lift precious metals.
Conclusion
- As always lots of data and lots of contradictory findings to digest. This is the result of mass psychology, complex market structures and a never ending stream of new developments. Welcome to the three-dimensional real-time puzzle....
- My last analysis has been pretty accurate with Gold topping at US$1,346.80. My short sell recommendation should have worked out very well. Four weeks ago I also said we should see a summer low around US$1.270,00-US$1,280.00. So far the lows came in last Thursday at US$1,286.95. On Friday afternoon Gold recovered back towards US$1,308.50.
- Due to the very bearish short-term sentiment readings I think Gold should have a few strong days next week. A recovery towards US$1,315.00 even US$1,330.00 might be possible. But I still doubt that this correction is already done. Instead I´d like to see the HUI closing its open gap and Kitco posting another survey with 60%+ bears
- The last two weeks have been quite similar to last year´s summer period. Back then Gold had been dancing and whipsawing around the US$1,300.00 level for around three weeks before a final sell-off took it down to US$1,273.00. Exactly from there the bull run towards US$1,434.00 started.
- I don´t see Gold falling below US$1,250.00. Only if the stock-markets are crashing this becomes a possibility. Due to recent strength in Chinese stocks this is not very likely at the moment.
- Swing traders need to be patient and avoid trading in this whipsaw environment. Scaling in with limit buy orders between US$1,281.00 and US$1,265.00 should be a promising recipe. Stops should be placed below US$1,240.00.
- Investors with a long-term perspective should have bought this week below US$1,300.00 according to my last newsletter. They should continue to accumulate physical Gold below US$1,285.00 and physical Silver below US$20,20.
Long Term
- Nothing has changed
- Precious Metals bull market continues and is moving step by step closer to the final parabolic phase (could start in summer 2014 & last for 2-3 years or even longer)
- Price target DowJones/Gold Ratio ca. 1:1
- Price target Gold/Silver Ratio ca. 10:1
- Fundamentally, Gold should soon start the final 3rd phase of this long term bull market. 1st stage saw the miners closing their hedge books, the 2nd stage continuously presented us news about institutions and central banks buying or repatriating gold. The evolving 3rd and finally parabolic stage will end in the distribution to small inexperienced new investors who will be subject to blind greed and frenzied panic.
********
Germany
E-Mail: [email protected]
Website: www.goldnewsletter.de
 Florian Grummes (born 1975 in Munich) has been studying and trading the Gold market since 2003. In 2008 he started publishing a bi-weekly extensive gold analysis containing technical chart analysis as well as fundamental and sentiment analysis. Parallel to his trading business he is also a very creative & successful composer, songwriter and music producer. You can reach Florian at: [email protected].


