Gold And U.S. Stocks, Cyclical Picture


 Last week's trading saw gold holding in consolidation mode for the greater-majority of the week, before forming both its high and low in Thursday's session. The high was made at the 1789.90 figure (June, 2021 contract), before dropping down to a bottom of 1754.60. From there, an upside consolidation was seen into Friday's session, to end the week marginally lower overall.
Gold's Short-Term View
For the very short-term, gold's recent correction has come as a result of the combination of 10 and 20-day cycles, with the larger 20-day wave shown on the chart below:
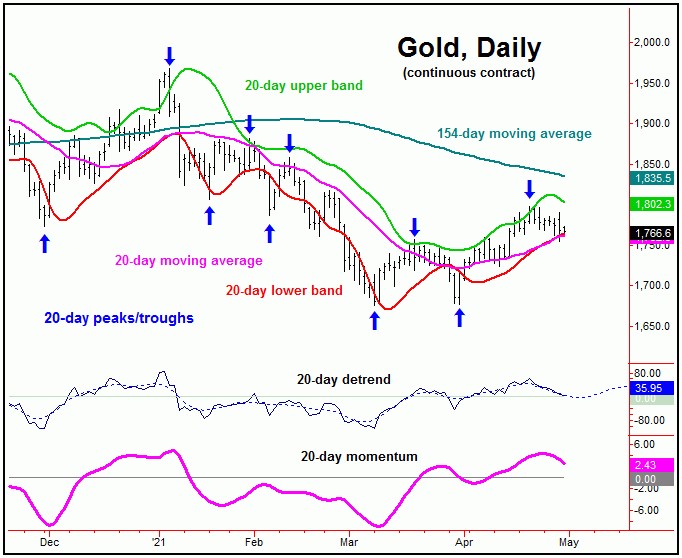
In our Gold Wave Trader market report, at the recent highs we noted that the correction phase of the 10 and 20-day cycles was readying to assume control. And - in following my rule that a cycle will nearly always (i.e., 85% of the time) revert back to a moving average of the same length - the analysis called for a drop back to or below the rising 20-day moving average, which was easily met with the action into last week.
With the above said and noted, the short-term picture is looking for the next low to form with this 20-day wave, a low which could even have been registered with Thursday's tag of the 1754.60 figure. Having said that, this is too early to say with any degree of certainty, though we are awaiting confirmation - with the exact upside ‘reversal point’ (i.e., confirmation figure for gold) noted in our Gold Wave Trader report.
Gold's 72-day Cycle
From the comments made in recent articles, the last rally of significance was expected to come from the 72-day cycle in gold, which is shown again on the chart below:
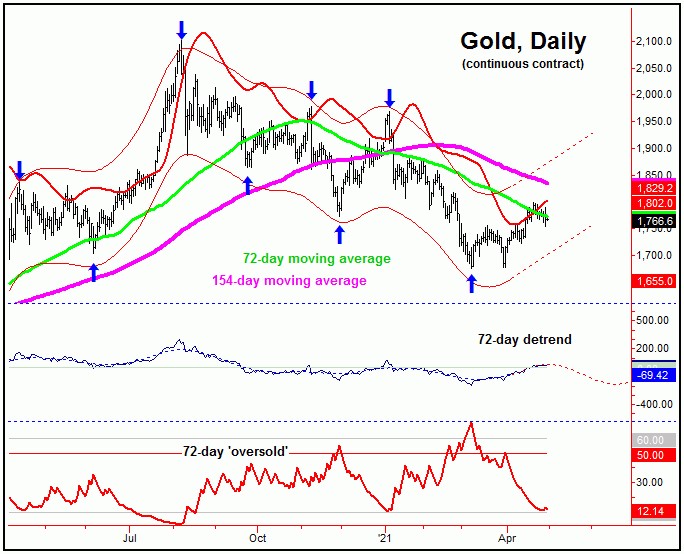
The last bottom for our 72-day cycle was made back in early-March of this year, doing so with the tag of the 1675.70 figure for gold. In terms of price, its current upward phase was expected to see a minimum rally back to the 72-day moving average, which the action in past weeks has obviously satisfied.
Having said the above, due to the position of a larger 154-day cycle that we track, my ideal path is looking for additional strength in the coming days/weeks, with the higher 154-day moving average acting as the potential magnet. That same moving average will also act as a key resistance level to the upward phase of this 72-day wave.
Stepping back then, the next good swing top for gold should come from this same 72-day cycle. Of note is that our detrend indicator is projecting this wave to turn south into what currently looks to be the month of June. With that, additional strength in the coming weeks - if seen as expected - should be followed by a sharp correction into June, where the next key trough is favored to form with this 72-day wave.
U.S. Stocks Topping
As mentioned in my article from last weekend, The U.S. stock market, as measured by the S&P 500 index (or 'SPX'), is forming a mid-term top, with that top expected to come from one of our largest-tracked waves, the 360-day (or 18-month) cycle:
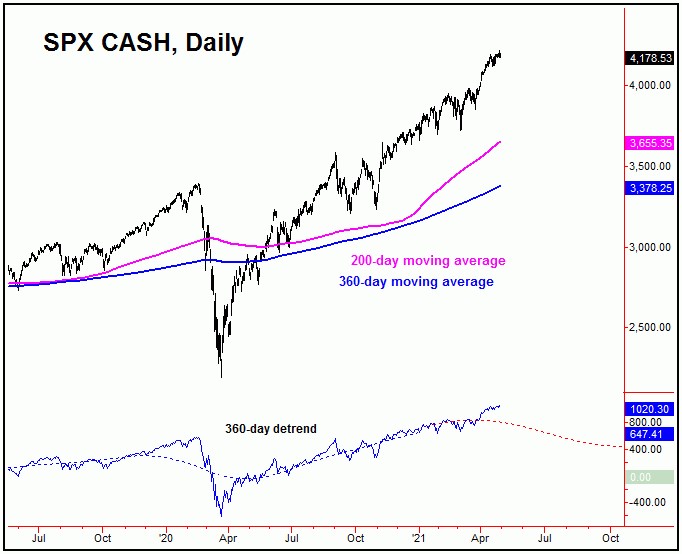
In terms of price, last Summer we were able to confirm an upside target for this 360-day cycle to the 3812.56 - 3960.44 SPX CASH region, which we noted had a decent shot of being met back in January of this year. This target was satisfied in that same month, and - since taken out to the upside - may now act as a support level going forward.
As mentioned earlier, the next mid-term peak for U.S. stocks is expected to come from this same 360-day cycle, which - being into a fairly wide topping range - could form at anytime. Once this peak is set in place, we are looking for the largest percentage correction of this year to play out in the weeks/months to follow. This coming decline should be enough of a magnitude that it will have many thinking that the larger bull market has run its course.
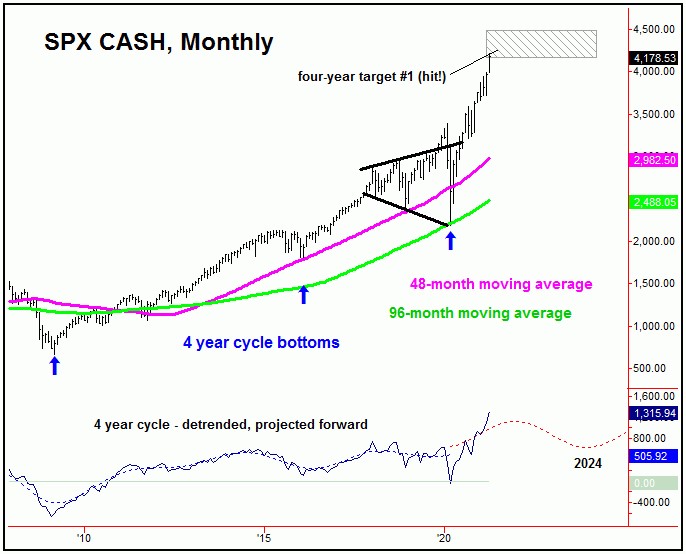
In terms of patterns, however, as mentioned last weekend the coming correction phase of this 360-day wave is favored to end up as a countertrend affair, due again to the position of the larger four-year wave, shown below:
The Four-Year Cycle in U.S. Stocks
The four-year cycle is seen as 279 trading days along and is currently labeled as bullish, with its upward phase expected to hold up into the late-2022 timeframe or later. Its next bottom - if made on schedule - is projected for the Spring of 2024, but does have a very wide plus or minus variance in either direction.
For this four-year wave, we know that the last trough for this component was the March, 2020 low of 2191.86 SPX CASH. From there, its upward phase was later indicated to be back in force, with an initial upside target confirmed (in the Summer of last year) to the 4157.83 - 4485.31 SPX CASH region. The lower end of this target range has been met with the action in recent weeks, with the upper-end of this range being key resistance.
In terms of time, with the average upward phases of this four-year cycle in U.S. stocks having seen rallies of 32-37 months before peaking, the overall assumption is that this wave is headed higher into the aforementioned late-2022 timeframe or beyond. Once we get into that timeframe, we will need to be on the lookout for hard technical evidence that this four-year cycle is topping - none of which we are actually seeing at the present time, with most of the major internals confirming the long-term trend.
For the bigger picture, from whatever peak that does form with this four-year wave (i.e., late-2022 or beyond), the probabilities will favor a very sharp correction in the months to follow, one which takes the SPX back to its 48-month moving average into what looks to be the Spring of 2024, again with a large plus or minus variance in either direction.
For the longer-term outlook, the same 48-month moving average is also likely to act as a major support level, if the upward phase of the larger 9 and 18-year cycles is to remain in force into the 2026-2027 timeframe.
In other words, the next correction phase of this four-year cycle is anticipated to end up as countertrend, with a 2024 bottom giving way to higher highs into that 2026 or 2027 region - before topping the larger 9 and 18-year cycles for a 'crash-like' decline to end the decade. More on this in a future article.
Jim Curry
The Gold Wave Trader
http://goldwavetrader.com/
http://cyclewave.homestead.com/
********


