Gold: Basing For The Next Move


Last week's trading saw gold registering its low in Monday's session, here doing so at the 1680.70 figure. From there, strength was seen into later in the week, with the metal pushing all the way up to a Thursday high of 1754.90 - before backing off the same into Friday.
Gold's Bigger Picture
Normally, we will look at the short-term view first, though this weekend I am bucking trend - and we will take a look at the longer-term picture. With that, the longest cycle that we track is the nominal four-year wave, which is shown on the chart below:
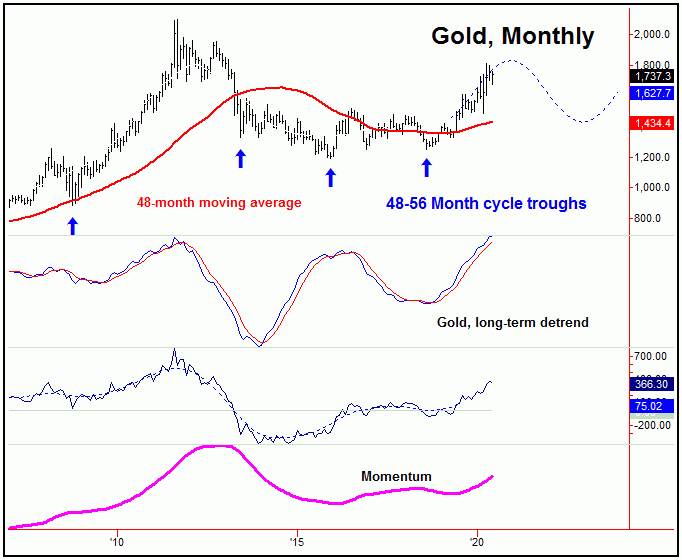
The last low for this four-year wave was registered back in August of 2018, and with that it is currently pushing higher, confirmed by the action in the detrend indicators, as well as momentum. Our projection for what this cycle should be doing in the future is the dashed blue (overlaid with price) indicator, which favors the upward phase of this wave to remain intact well into late-year.
For each tracked cycle, we look at our detrend indicator first, which always shows past cycle bottoms - which we will use for statistical information on what to expect in the near future. The detrend also acts as a real-time measure of momentum, and gives us a certain degree of information on what is going on now, though our actual momentum indicators seem do a better job.
I should add that cycles are dynamic. That is, there is always a plus or minus variance to contend with, which is normally about 20% in either direction. In other words, a 34 day cycle would be expected to have a plus or minus variance of around 7 days in either direction, and we would expect cycle bottoms to fall into this range about 80% of the time. The remaining 20% of the time the expected lows will fall outside of this range.
Going further with the above, there is also a variance with magnitude with each of the tracked cycles. With that, a good general forecast path for the market is possible, though the roadmap is very general - and we have to use other technical measures for trade entries and exits.
The 310-Day Cycle Component
The second longest wave that we track is the 310-day cycle, which is shown on our next chart:
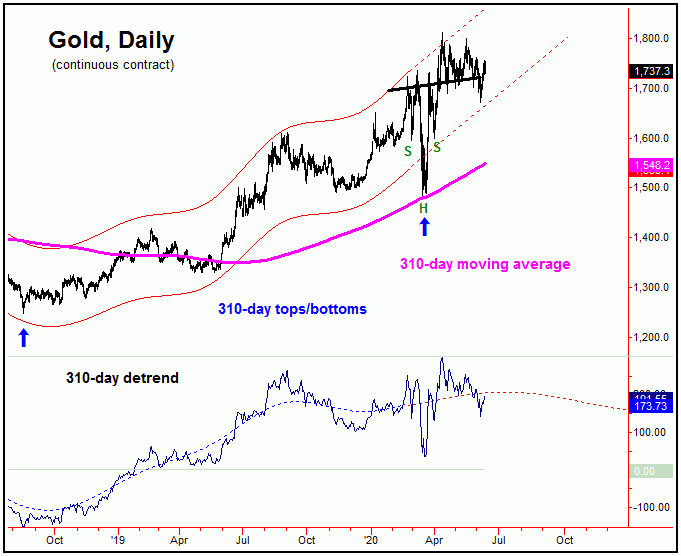
With our 310-day cycle, though not shown, most of the momentum measures that track this wave have this wave heading higher into later this year, which is in line with the assessment from the larger four-year component. In terms of time, this wave was actually due to trough around the month of April, but - due to the aforementioned notes on the larger plus or minus variance - its bottom came slightly on the early side, troughing back in mid-March.
In terms of price, however, our expectation for this wave was that a decline back to the 310-day moving average would be seen as this wave bottomed - which was hit back in March, and also acted as a key level of support for the metal.
In terms of technical chart patterns, we have the classic inverted 'head & shoulder' pattern shown on our 310-day chart, which targets an eventual test of the 2000 level (plus or minus) in the coming months. In terms of time, the highest-odds for this target to be hit should be later this year, as suggested by our four-year cycle.
The 72-Day Wave
For the more near-term view, we scale down to the 72-day cycle, which is shown on the following chart:
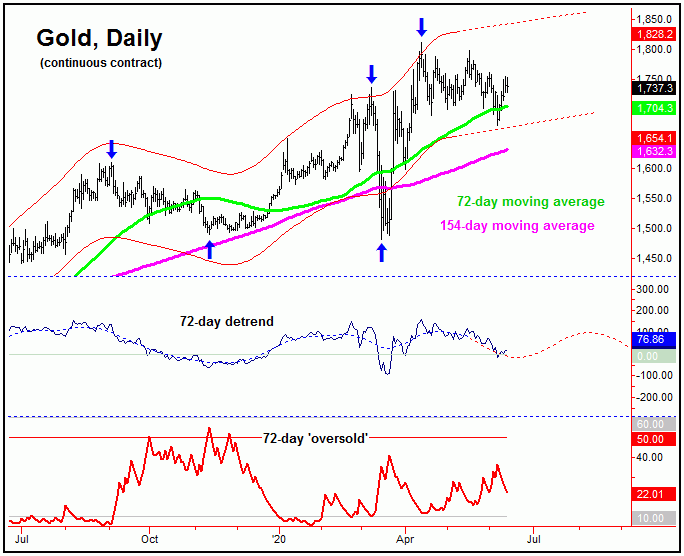
On the chart above, of note is that our detrend indicator has been pointing lower in recent weeks, with the cycle itself projecting a bottom at anytime - and a rally for the coming months. In terms of price, our minimum expectation was that a drop back to the 72-day moving average would be hit, though with the potential for a decline back to the lower 154-day moving average. Right now, based upon everything that I am seeing, a decline back to the 154-day average now appears less likely, and we may have to wait until August for that to be tested.
With the larger-degree 310-day and four-year cycles heading higher, the goal is to buy a 72-day cycle trough in the current timeframe, if the technical conditions develop. Otherwise, should momentum measures turn up at any point going forward, then we should be looking to catch the next wave - and with that would have to be looking to buy declines into smaller-degree lows. Obviously, some patience is required.
Patterns
Adding to the comments above, the position of the larger-degree cycles will tell us what to expect in regards to what the cycles of a smaller-degree will do. That is, if the larger 310-day and four-year cycles are pointing UP, then we should expect declines into our smaller-degree lows - such as with the 72-day wave - to end up forming a series of higher lows. In other words, any decline with the 72-day cycle would be favored to end up as countertrend, against the mid-March trough.
Going further with the above, when a cycle - such as the 72-day wave - is able to form a 'higher-low', then we have found that the probabilities are 80% that the next upward phase of the wave will take out the prior peak for the cycle. Here, we know that peak for the 72-day cycle was the 1811.40 figure. Thus, we have to expect that - if and when the next upward phase of the 72-day cycle is seen - that prices should push back above that 1811.40 figure.
Summing It Up
With the above said and noted, the overall analysis for the coming months is that gold will continue with its choppy action, but with an overall bias to the upside - due to the larger-degree cycles. Having said that, the real 'meaty' (trending) part of the next strong push higher won't likely come until after both the seasonals and the time cycles align - which will occur from August of this year, and should last into the later this year, with more precise details noted in our Gold Wave Trader market report.
Jim Curry
The Gold Wave Trader
http://goldwavetrader.com/
http://cyclewave.homestead.com/
More from Gold-Eagle


