Is Gold Bottom In? Nothing Confirmed


 Confirm – verb – To establish the truth or correctness of (something previously believed, suspected, or feared to be the case). State with assurance that a report or fact is true.
We are again seeing more and more experts and non-experts calling for the bottom for gold and silver, but none can confirm it as a proven fact. Few realize how important it is to have confirmation that one’s position is correct and will be profitable. It is confirmation that gives validity to a prior market move/event. This is the theme of our analysis, today.
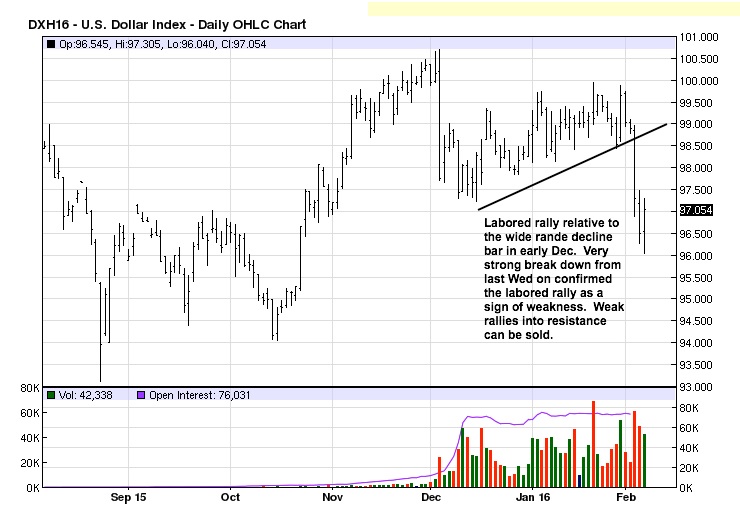
Last week, we said the labored rally relative to a strong decline bar, on a weekly fiat “dollar”chart, while not trying to call a top, the market structure revealed weakness that the “market is not internally strong.” [See Current Prices Do Not Matter), first chart and two paragraphs above.
We got confirmation of that assessment last week when price dropped like a waterfall through the 98.50 level without looking back. We do not follow the fiat “dollar,” beyond noting it is the globalist’s worst enemy for exposing the fraud behind fiat currencies.
The highest volume day on the chart shows a failed probe higher with a very weak close on that day, a clue that a likely turn was near, and that was confirmed several TDs later. The
wide range decline bar, last Wednesday, confirmed the analysis that the market structure was weak. This is how one uses developing market activity to advantage.
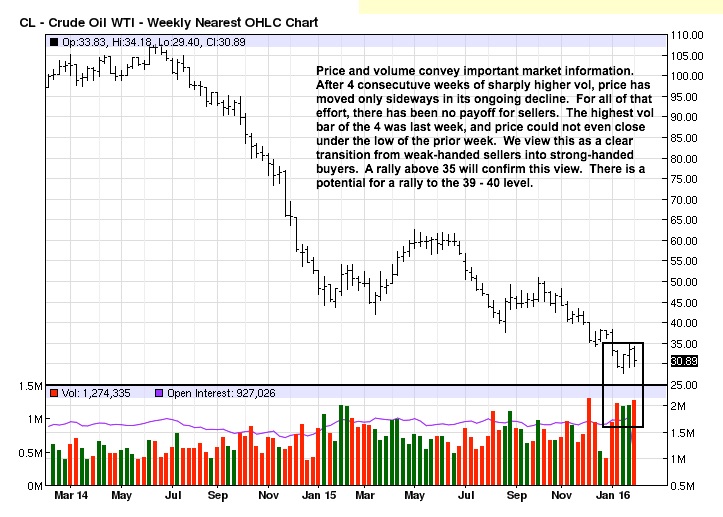
Crude oil is the opposite to the fiat situation, above, crude being at current lows where the fiat was near current highs. The information in price and volume is sending a message that there is a shift in the market from sellers to buyers. Increases in volume are always the hallmark of smart money, those with strong hands for accumulating and holding positions at important market turns, [in down trending markets].
Think of volume as energy exerted, and the highest amount of exertion is taking place. In an established down trend, in which crude oil is, sellers have the upper hand over buyers. Yet, for all of that effort, price has only been able to move sideways without going any lower from the high volume start four TDs ago.
How do we know that the message of the market is telling us there is a shift from weak handed late sellers into string handed buyers? Smart money always buys at/near lows. Coupled with the fact that a sharp increase in volume is smart money operating, we know individual/smaller traders never act in concert sufficiently to generate that level of high volume. All the small traders do is react to large increases in volume.
In line with the theme of this week’s analysis, all that is needed now is some form of confirmation in market behavior to the upside, and then a rally will be underway.
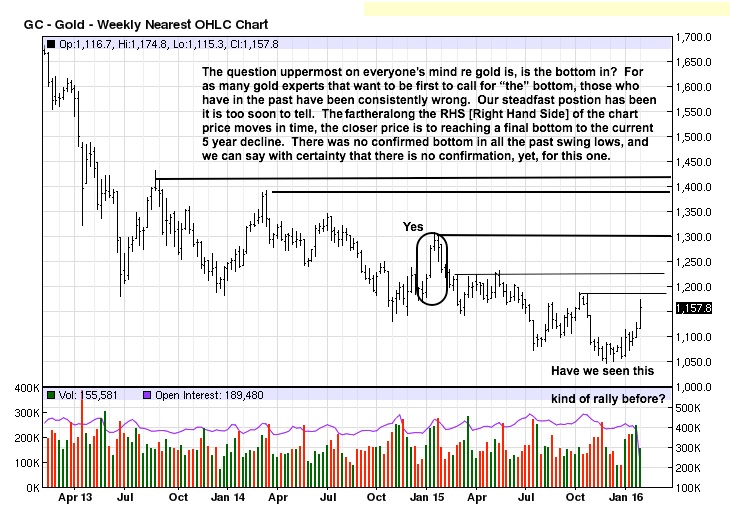
The purpose of articulating the importance of confirmation is now focused on gold and silver because of the increased calls for a [possible] bottom in both. We do not believe there is anyone who can state with certainty or as fact that the bottom is in for gold and silver. There are many opinions based on strong beliefs, but beliefs and reality are not always the same. Beliefs are often lacking in proven facts, but that is a different discussion. The point to be made is there is no confirmation that a bottom exists for gold or silver.
The weekly chart shows large areas of overhead resistance that gold must overcome. How is the current rally any different from the similar one back in January 2015? That rally was not confirmed, and price continued $250 lower. It takes time for bottoms to form. Can this time be different? Absolutely! However, to be different, newly developing market behavior must confirm past developed market behavior, and that confirmation is absent, to date.
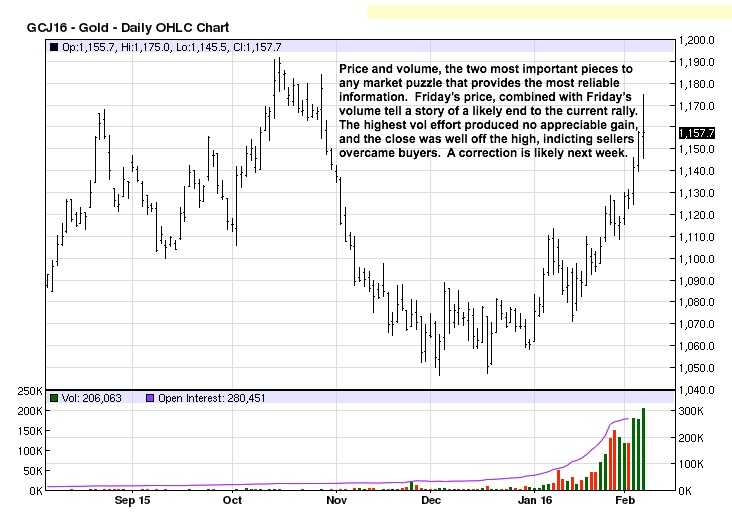
The daily chart actually gives possible confirmation the two month rally underway may be about to undergo downside reaction. See the swing high from mid-October 2015 and the failed retest rally near the end of October with a wide range bar lower, as was described in the daily fiat chart, 1st chart in this article.
Friday’s rally is retesting the failed rally area from October 2015. We see the widest range bar and the highest volume of the rally on the same day, last Friday. The important tell, or clue, comes from the location of the close: just under mid-range the bar, barely higher than the day’s open, and almost at the previous day’s close.
For all of the buyer energy exerted, the close was weak, as described. This tells us that sellers overwhelmed the effort of the buyers and pushed price well off the highs of the day. Those who sold last October 2015 are defending their short positions is the explanation why the gold price ( reacted as it did. A price reaction lower, next week, would confirm the fact that a previous failed high held/checked the current rally.
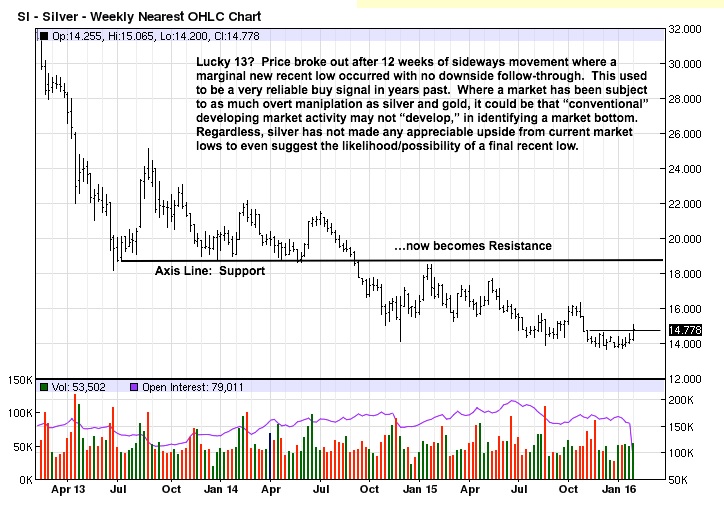
Silver’s rally has the look of a possible extended rally, but the 2 strong sell bars from last October could spell trouble, similar to what gold showed, above. Markets are always testing and retesting previous market activity. For as positive as the potential is for a price rally and close above 12 weeks of sideways movement, silver is still coming from a level of weakness and without a confirmed bottom in place.
The daily charts backs up the observation from the weekly chart. Price made a new recent rally high but closed lower than the previous day while at a 50% retracement/potential resistance area. In down markets, half-way retracements tend to check rallies. What happens in the next several trading days will confirm, one way or the other, a failed swing rally high or a rally breakout. Money is made by following the market’s proven and confirmed behavior.
The information gleaned from chart market activity, in the form of price/volume behavior, is telling us that no bottom has been confirmed and factually speaking. Many may believe otherwise.
Keep buying the physical.
*********
Courtesy of http://edgetraderplus.com


