Gold Breakout!
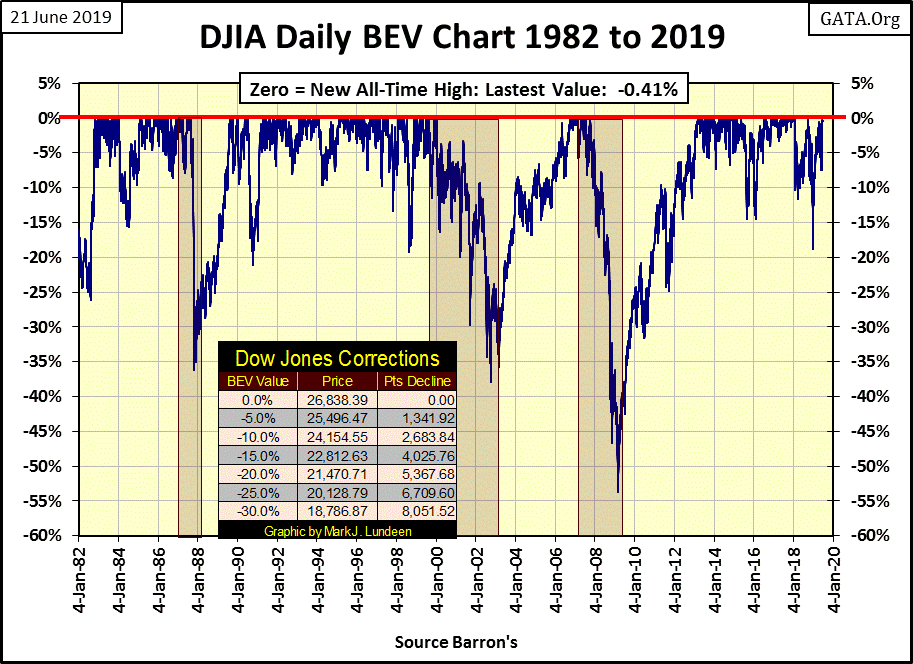
Two weeks ago the Dow Jones crashed into its BEV -7.5% line. My reaction to that was to become a bear on the stock market. Now ten NYSE trading sessions later, it’s advanced to within a half of a percent (0.41%) from its all-time high of last October 3rd. I became a bear two weeks ago, and should the Dow Jones go on and make a new all-time high from here, I’m going to remain in Mr Bear’s camp. How much more does the stock market have to offer investors? As I view the market, not much.
I don’t like this bull market, as it’s only a staged event with nothing real to it. Look at the 09 March 2009 -54% market decline in the BEV chart above. With the entire global banking system upchucking non-performing sub-prime mortgages, why did the Dow Jones stop there in a world where basic banking functions had ceased to function? Why didn’t it continue down to the BEV -70% line and below?
We all know the answer to that; Doctor Bernanke and the entire global central banking cartel bailed out their banking system. Now ten years, and over 20,000 points in the Dow Jones later all that is forgotten. But not by me, as I see growing cracks in the foundation of debt supporting this market advance.
The Federal Reserve has announced (link below) that some $1.1 trillion dollars of corporate debt is a potential risk to the financial system.
“Companies with large amounts of debt are borrowing more money at a breakneck pace, prompting the Federal Reserve to flag the trend as one potential risk in the financial system.
“Loans to companies with large amounts of outstanding debt — known as leveraged lending — grew by 20 percent in 2018 to $1.1 trillion, according to the Fed’s twice-annual Financial Stability Report. The share of new, large loans going to the comparatively risky borrowers now exceeds peak levels reached previously in 2007 and 2014.
“* Defaults on these loans remain low, but the Fed warned that could change if the economy faltered. *”
May 6, 2019
https://www.nytimes.com/2019/05/06/us/politics/federal-reserve-risky-corporate-loans.html
Funny how the media companies like the NY Times never asks basic follow-up questions like which companies or industry groups the Fed is warning about. Or maybe the Federal Reserve does, but the editors never pass on the information to their readers. No, that’s not how this works. This press release by the Federal Reserve isn’t trying to keep the public informed, they’re only covering this issue to cover their asses when the bottom falls out so they can say “you can’t blame us because we told you so.”
Here is Bloomberg’s take on the above Fed Announcement
https://www.bloomberg.com/markets/fixed-income
As I noted last week, the St. Louis Federal Reserve reports $6.4 trillion in corporate debt, making this $1.1 trillion 17% of the entire corporate debt market. That’s a lot! And in a classic understatement of the risk this situation presents to the public, “Defaults on these loans remain low, but the Fed warned that could change if the economy faltered.”
If the economy falters, many if not all of these bonds will be defaulted on, resulting in corporate bankruptcy and growing unemployment. Here’s how this works: more debt defaults = more economic decline / more economic decline = more debt defaults. So, companies appearing healthy and capable of servicing their bonds today might appear very differently as the economy and financial markets begin to deflate tomorrow.
Then we’ll discover there’s always another tranche of dubious bonds to take their place, waiting to take their turn in front of Mr Bear’s firing squad. This process will continue until we see just how many of the corporate bonds in the $6.4 trillion total, really are AAA rated.
That the FOMC and the banking system it controls has allowed this situation to develop was uncommented on by either the NY Times or Bloomberg. That is the truth though.
Remember back in October 2008 when Doctor Bernanke from the Federal Reserve said if Congress just gave the Fed more regulatory power in the financial market, problems such as the sub-prime mortgage crisis wouldn’t be possible. The Congress gave the Federal Reserve everything Doctor Bernanke asked for, and now ten years later 17% of the corporate bond market is at risk of default in an economic downturn.
But it’s the educational system that’s really to blame. After four years of college, graduates no longer know how many genders humanity has or anything worth knowing about economics or life in general.
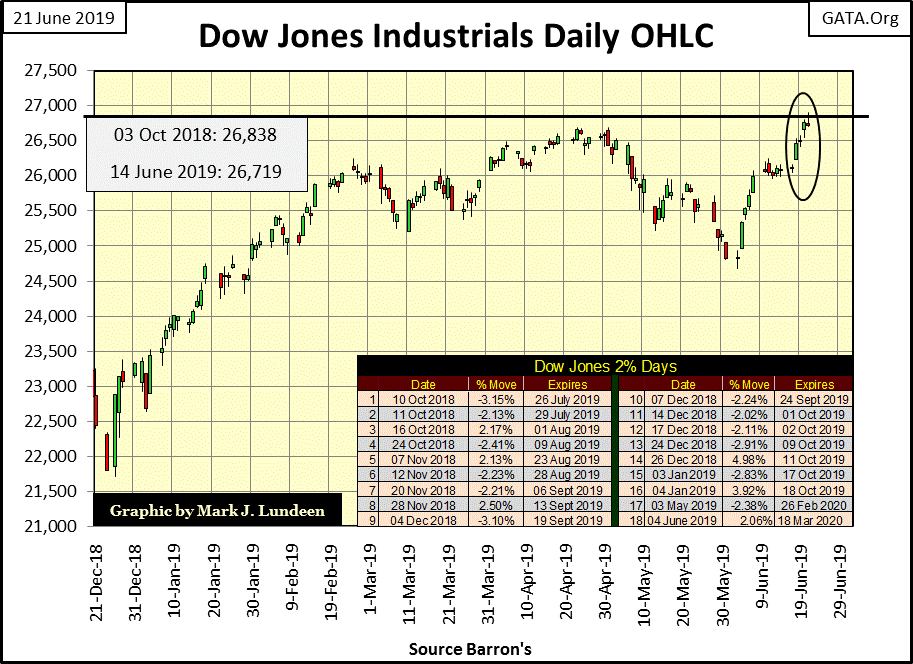
Here’s the Dow Jones in daily bars. The thick black line is the last all-time high of October 3rd of last year (26,838). On Friday’s trading the high for the day was 26,907; into record territory, but by the close of the day the Dow Jones settled at 26,719. Please note the bearish head and shoulder chart formation noted last week is now gone – that didn’t last long.
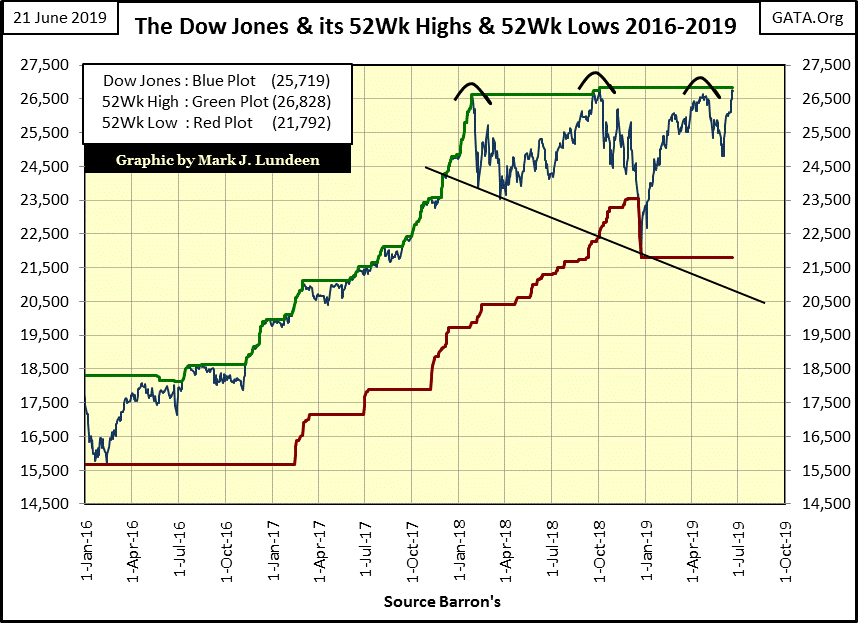
Last week I noted two head and shoulders chart formations; the second seen in the next chart plotting Dow Jones with its 52Wk High and Low lines. Should the Dow Jones take out last October’s 26,828 in the coming weeks, you can say goodbye to this bearish chart formation too.
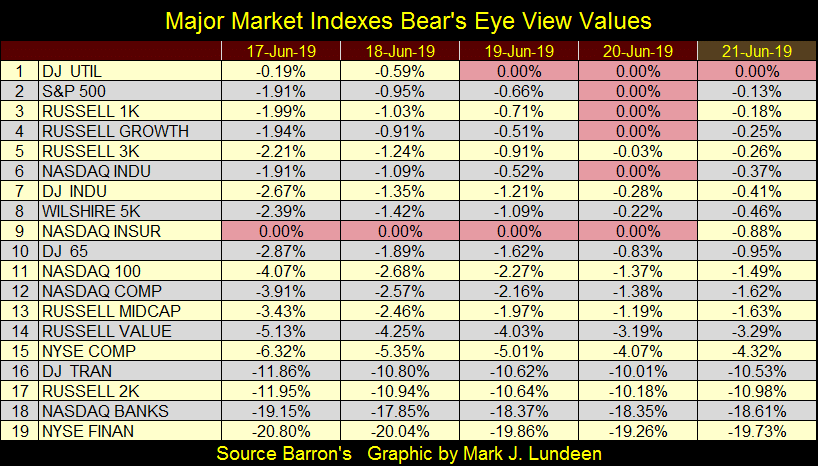
The major market indexes in their BEV Value table below were beginning to make new all-time highs (0.00%) like popped corn in a microwave last Thursday; then came Friday and things cooled down in the market. However, as you can see the Dow Jones (#7) has yet to break above its last all-time high of last October, but closed only 0.28% from doing so last Thursday. In the weeks to come the Dow Jones should once again close at record highs; what’s to stop it?
Yes, what is there to stop it? I don’t know; but if the Dow Jones old record high of last October is still standing in the weeks to come it would be a scary situation in my opinion. But I don’t expect that will happen.
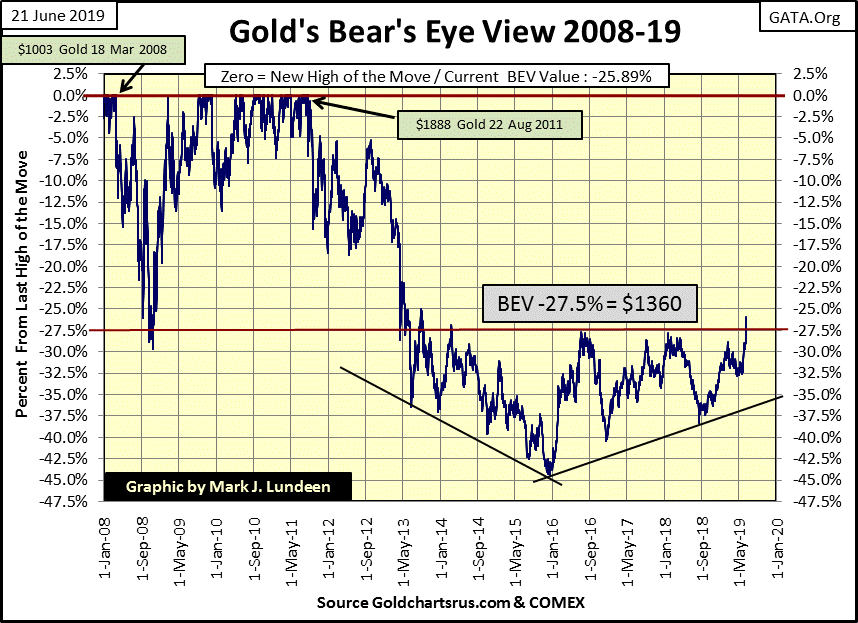
Let’s move on to gold’s BEV chart – NICE! It’s taken years, but gold has finally broken above its BEV -27.5% line-of-resistance in the chart below, closing the week at six-year highs. Has something has changed in the gold market? I’d say so!
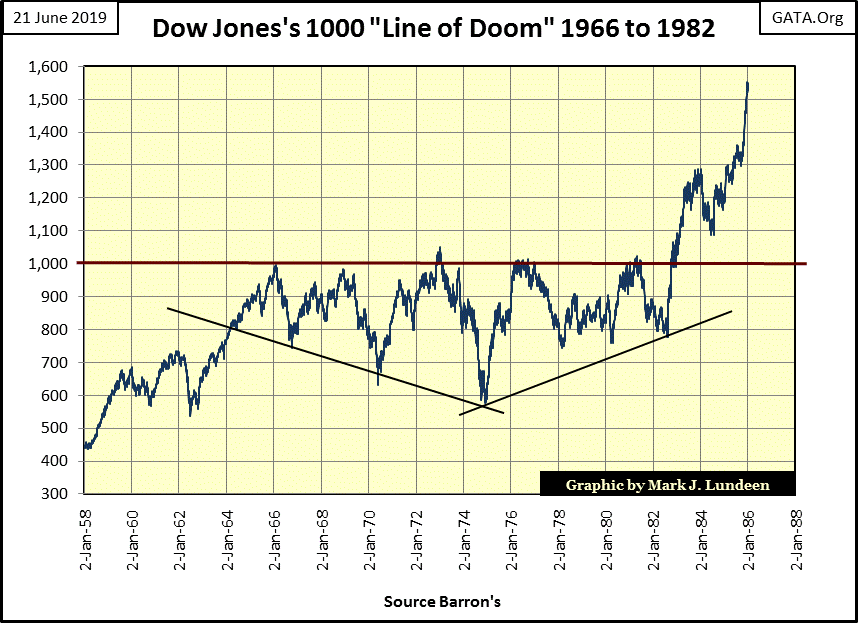
Looking at gold’s BEV chart above the market action from early 2013 to today is very interesting. From May 2013 to its December 2015 lows, valuations only trended lower, after which we see a series of rising lows, with the entire six year period capped by a level that couldn’t be exceeded. This chart formation reminded me of the Dow Jones from 1966 to 1982 in the chart below.
By its 1982 autumn break out, only a brave few believed the Dow Jones would do anything but collapse back down below its 1000 line of resistance. Many market commentators at that time still believed the place to be was in precious metals investments.
But thirty-seven years ago the scoffers of the Dow Jones were wrong, and now in 2019 it’s trading over 26,000. And those who recommended gold in 1982 gold ultimately discovered it was only in the second year of a two decade long bear market.
Take a moment to study these two charts. I expect we’ll soon see market history repeat itself. And for reasons unique to the gold market, such as the pending dearth of gold (and silver) for individual investors as central banks have locked up current above-ground supply in their vaults, I expect the coming advance will be much more violent than seen by the Dow Jones in the 1980s.
The Mainstream Financial Media (MFM) spends time covering the crypto currencies. Who doesn’t know Bitcoin is once again going up like a rocket? But what the MFM fails to report to their audience is how the global central banking cartel is buying gold in a big way, and has been for the past few years.
https://duckduckgo.com/?q=central+banks+buying+gold&atb=v82-1&ia=web
I think this shifting attention away from official interest in gold is intentional. The last thing these central banks would want is for the world’s investors to each want to purchase a few ounces of gold, as they know just how rare gold is and they don’t want to share it. So, the MFM keeps the public’s attention on the stock market and crypto currencies.
By the time the general population of investors become as interested in gold as they are in social media companies, where they arrive at the point where they actually want to buy, the supply of gold available to the public will be very tiny compared to the tsunami of dollars, yen, pounds, yuan and euros that at that time will be competing to purchase it. How high could gold soar to?
For over a decade I’ve speculated that $30,000 an ounce gold was locked in, and when gold is going for over $30,000, people with $30,000 will be plentiful but people with an ounce of gold willing to exchange it for paper money will be increasingly rare.
Precious metal miners will prosper in such a market, as gold and silver in all its forms, including in ground ore bodies will become increasingly valuable and desirable investments.
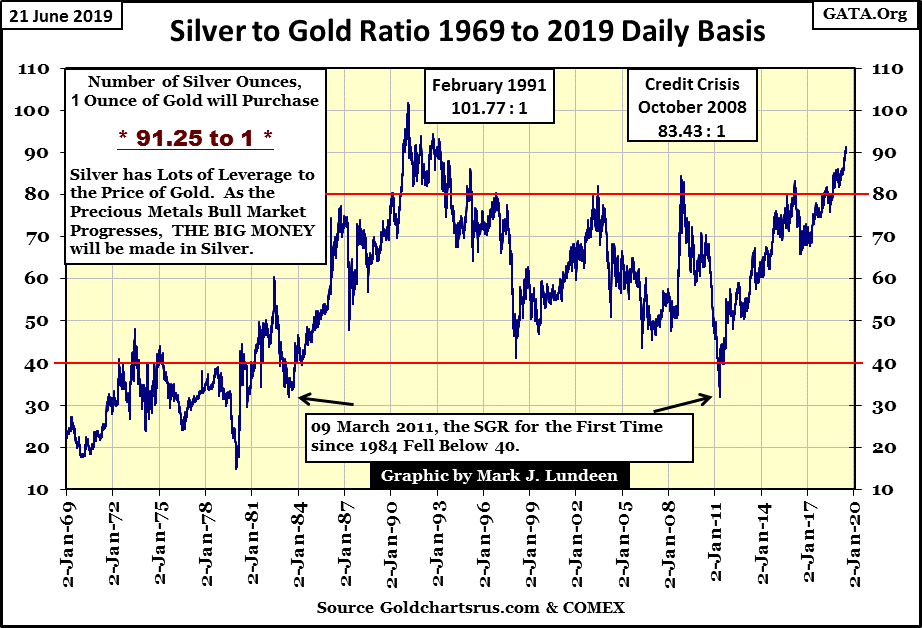
The silver to gold ratio (SGR) closed the week at 91 ounces of silver to one ounce of gold. For someone today with $30,000 who wants to purchase gold, instead of buying only twenty-one or so ounces of gold, a little more than a pound, I’d recommend they purchase three “Monster Green Boxes” of silver eagles. Each box containing 500 silver eagles, or 1,500 silver eagles (1,500 ounces of silver) almost 100 pounds of silver in total.
Any money left over can be used to purchase a junk-grade gold-double eagle from the 19th century as a golden keep sake. The stories a coin like that could tell would be amazing, if coins like that could talk, which of course they can’t. But a 19th century gold-double eagle is a real piece of history anyone would be proud to own and pass on to the next generation.
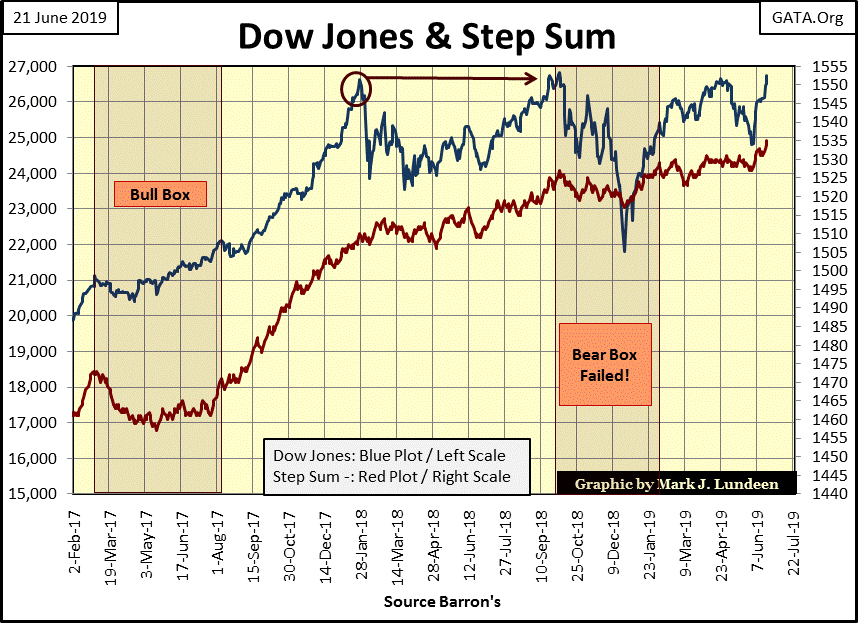
So how’s the step-sum bear box in the Dow Jones step sum chart doing? After last week, not so good. But depending on what the Dow Jones does in the coming months, should it find its valuation above 27,000 a heavy weight to bear, we’ll be back to where we were last week.
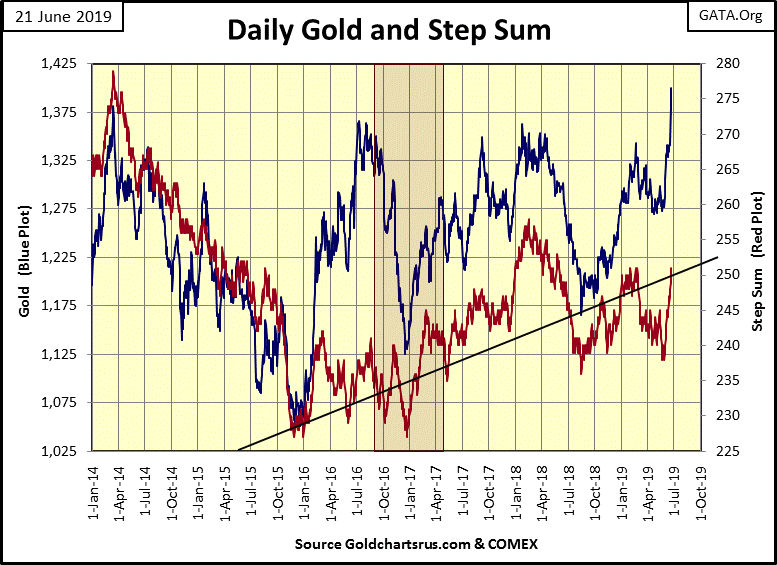
Next is gold’s step sum chart – Yahoo! What a great looking chart and we can expect more of the same in the weeks and months to come. After a market has been held back for a long period of time, in gold’s case held below $1360 for six years, the break out can be very dramatic.
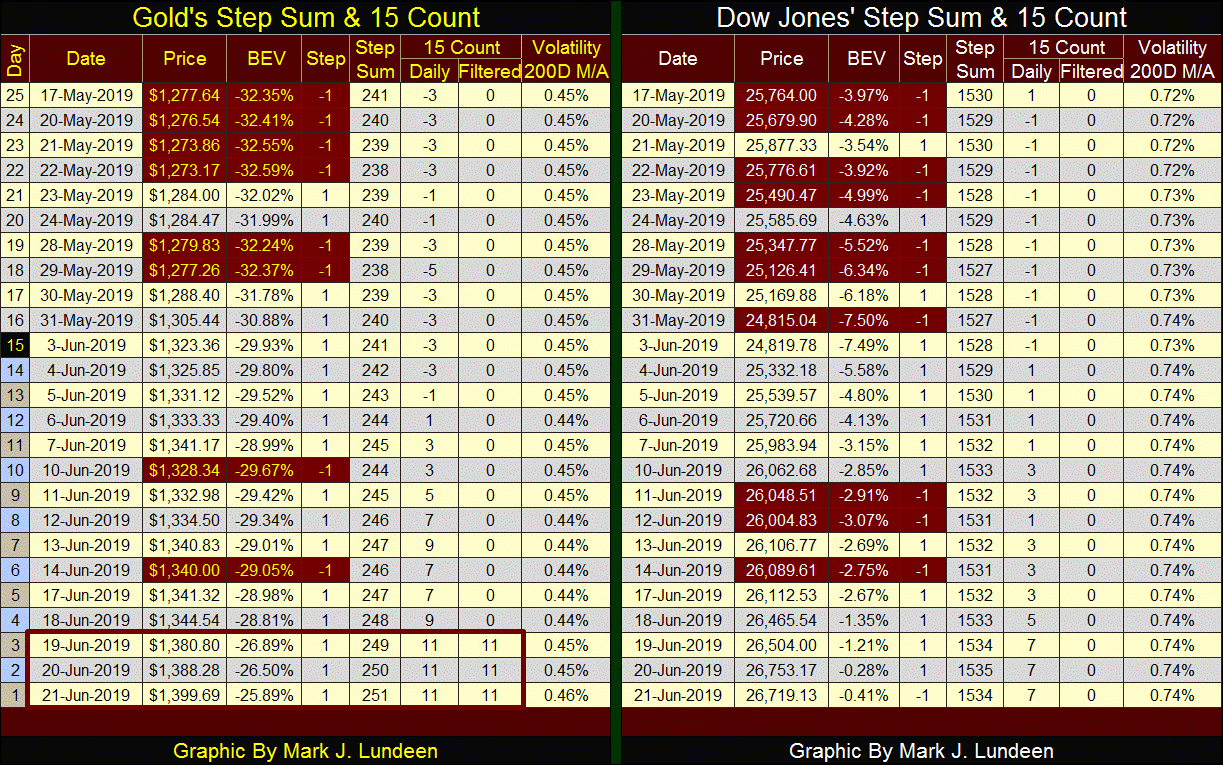
In gold’s step sum table below I note its volatility closed the week at 0.46% after the large daily gains seen this week.
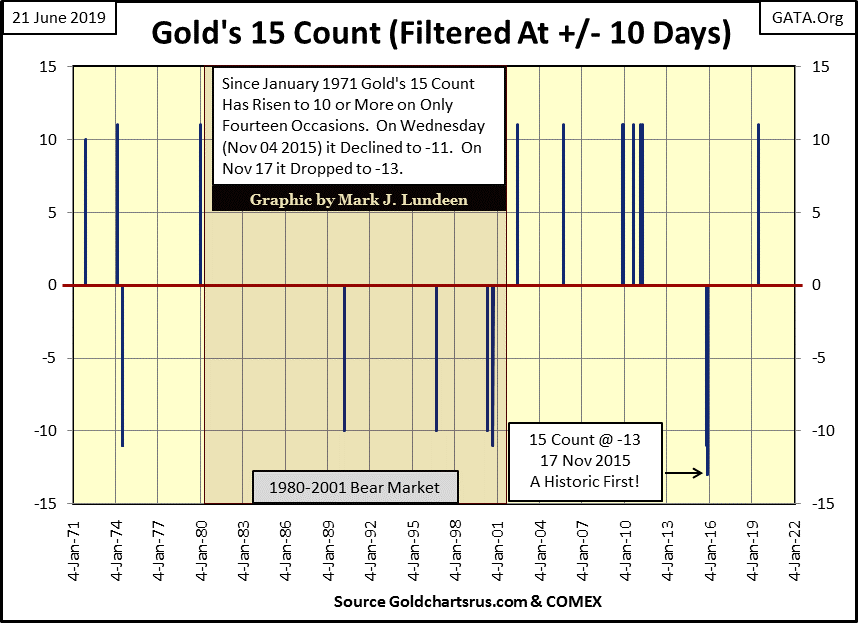
Also gold’s 15 count saw a rare double-digit valuation this week. That doesn’t happen often. The last was a -13 seen in November 2015 (chart below) just days before gold’s hard bottom of December 2015. What’s a -13 in the step sum count? Out of 15 trading sessions only one day saw the price of gold advance above a previous day’s close, as seen in the table below. This week’s +11 meant that in the past 15 trading sessions, gold only closed down for two days, as thirteen saw the price of gold advance.
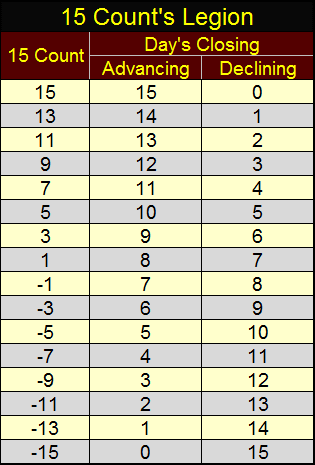
Seeing such a concentration of advancing or declining days in a count, in this case a 15 count, a 15 day running sample is one of those rare market events I like to follow. Gold’s -13 seen in November 2015 marked the bottom of the post August 2011 bear market, the point in time where the bulls capitulated to Mr Bear, thus marking the bottom of a multi-year -45% decline.
You may want to go back up and take a quick look at gold’s BEV chart to see this bottom, and gold’s step sum chart too.
What does this week’s +11 in gold’s 15 count portend? As of June of 2019, gold, silver and their miners are anything but precious to the general investing public. The old monetary metals have been advancing in a bull market since December 2015, but at this week’s close, gold has advanced by only 33% as silver’s gains of the past two and a half years is a pathetic 10%.
Compared to the capital gains possible from social media stocks, gold and silver offered little to investors since their December’s 2015 bottoms. With gold’s 15 count breaking to a +11 this week, I expect precious metals investments are entering a period where investors, like central banks before them, will once again find them increasingly attractive.
As these markets are tiny compared to the flow of funds that potentially could come their way, daily volatility could become explosive at some future date.
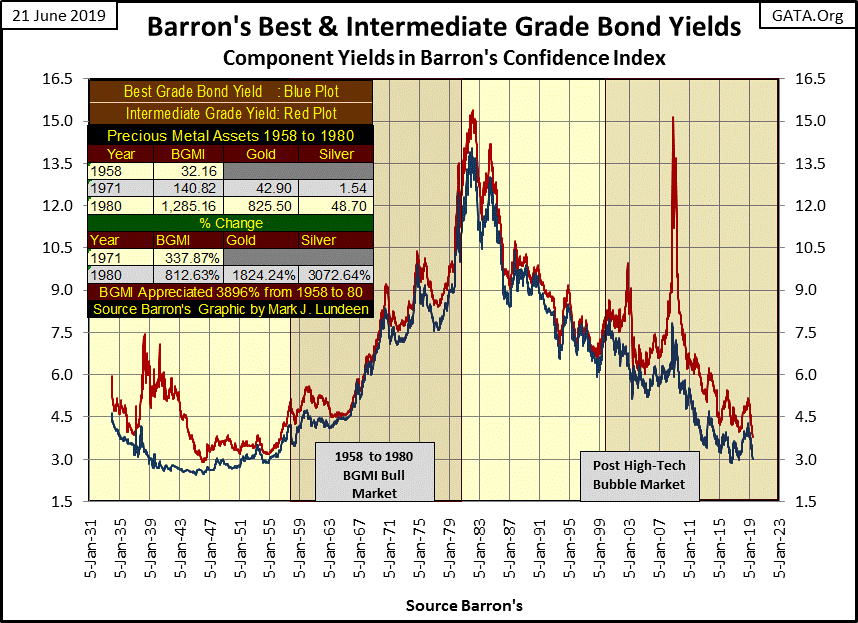
And when will that be? When the Dow Jones begins to deflate and interest rates and bond yields rise up to, and above those seen in the market before the 2007-09 credit crisis. See chart below.
For Barron’s Best and Intermediate Grade Corporate investment grade bonds, that would mean yields increasing above 6%. This week Barron’s Best Grade bonds were yielding 3.00% and their Intermediate Grade Bonds were yielding 3.80%.
For these bonds to double their yields, returning to where they were before Doctor Bernanke ratcheted down bond yields with his quantitative easings and “Operation Twist”, their prices would have to be cut in half. And that is where the money is going to come from to drive the prices of gold and silver upwards – investment capital fleeing deflation in the financial markets.
What could cause that? Go back and read the press release from the Fed on the $1.1 trillion dollars in corporate debt at risk of default (17% of a $6.4 trillion dollar market). Everything appears fine today, but someday something is going happen that will change everything. And you will want to hold your position in gold and silver bullion before the line forms at the door to the coin shop in your town and internet vendors post out of inventory on their websites.
Mark J. Lundeen


