Gold Building Foundations For Rally


 Gold has been steadily trending up since its early November low. The Swiss gold vote was expected so it was no surprise to see price turn back up after the initial dip in price. I still believe gold is on the cusp of a much greater rally so let’s see where things currently stand.
GOLD DAILY CHART
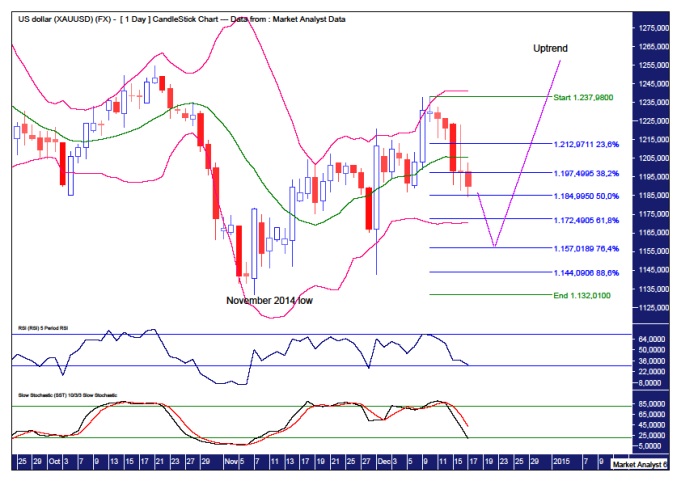
We can see a pattern of higher highs and higher lows indicating a bull trend. It is only the daily chart so nothing to get too carried away with but big things start with small things.
The Bollinger Bands show price trading well outside the lower band after the Swiss gold vote. This behaviour is consistent with solid lows. Price then traded up to the upper band but has since retreated and now looks to have the lower band in its sights once again. Another low outside of the lower band would look good for the bulls.
I have added Fibonacci retracement levels of the move up from November low. Looking retroactively the low after the Swiss gold vote was right around the 88.6% level. I favour this next low to be around the 76.4% level at US$1157.
The Relative Strength Indicator (RSI) and Stochastic indicator are both back around oversold levels so perhaps a low is not too far away.
GOLD WEEKLY CHART
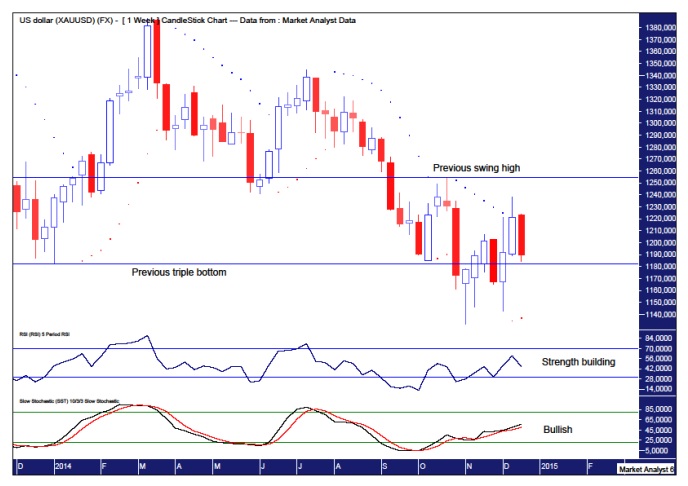
The RSI is showing a pattern of higher highs and higher lows indicating strength is building while the Stochastic indicator is trending up and looking bullish.
Price is currently milling around the previous triple bottom level. I expect price to dip back under this level one last time before the rally higher really kicks into gear.
The Parabolic Stop and Reverse (PSAR) indicator now has a bullish bias after price busted the dots to the upside last week. As often happens after this event price then comes back down to test the support. The dots currently stand at US$1137 and breaking that support now would look bearish in my opinion.
I expect the current move down to extend into next week and providing it holds support the next target will be trading back up and busting above the previous swing high level which stems from the October high at US$1254.
Breaking to new lows now below US$1132 would be very bearish but I doubt that scenario.
So, the rally still looks to be building its foundations which should provide the springboard for a much larger rally in the very near future.
********
My website is www.thevoodooanalyst.com
© 2014 Copyright The Voodoo Analyst - All Rights Reserved
Disclaimer: The above is a matter of opinion provided for general information purposes only and is not intended as investment advice. Information and analysis above are derived from sources and utilising methods believed to be reliable, but we cannot accept responsibility for any losses you may incur as a result of this analysis. Individuals should consult with their personal financial advisors. Put simply, it is JUST MY OPINION.


