Gold Bull Will Run For Years – Here's Why


If we want to make intelligent forecasts and decisions about our future, we need to understand not only where we are today, but also how we got here. So let’s look at previous gold bull markets for some insight on what we might expect from this one.
Gold enjoyed a tremendous bull market in the 1970s. That decade was fraught with geopolitical uncertainty, an oil embargo and big inflation to name a few. Of course, many of these factors were already in place and building up in the years before, but they came together by the early 1970s.
One of the biggest historical events was when U.S. President Richard Nixon cut the dollar’s tie to gold in August 1971. Until then, foreign nations could convert their U.S. dollar holdings to gold upon request. Many began doing so as they saw the U.S. rapidly increase spending, which weakened the U.S. dollar.
Closing The Gold Window
In order to avoid draining its gold reserves, Nixon simply closed the gold window. The currencies of many of the U.S.’s largest trading partners gained strength, and the dollar lost a third of its purchasing power that decade.
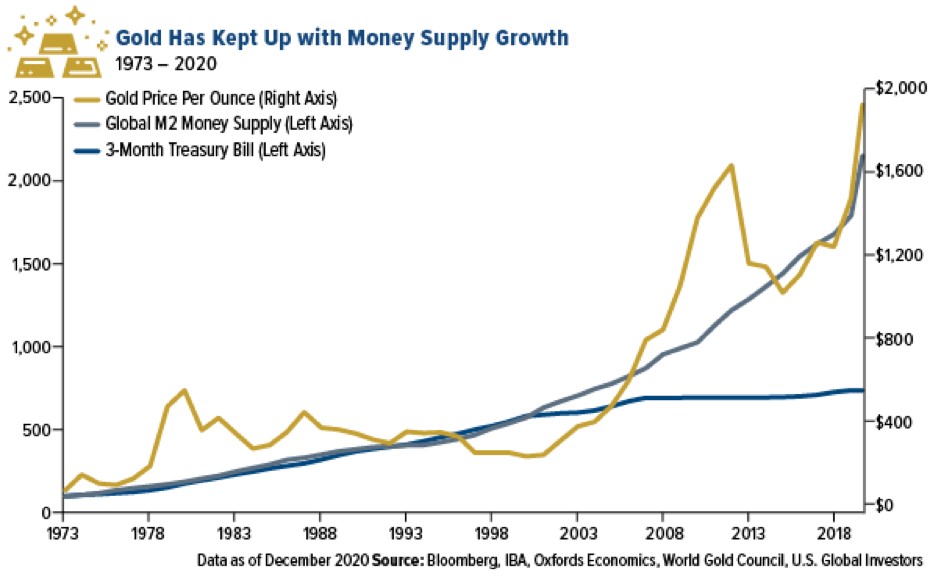
Gold, Money Supply, 3-Month Treasuries.
Naturally, a rapidly depreciating dollar was great for commodities. Gold, in particular, absolutely soared.

Gold Prices in 1970s.
The metal’s price began around $35 per ounce, and topped out near $850, producing more than 2,300% return!
New Millenium, New Gold Bull Market
By 2001, the more than two-decade long stock bull market culminated in a popping tech bubble. At the time, gold had been in a multi-year bear market, and finally bottomed in April 2001 around $260.
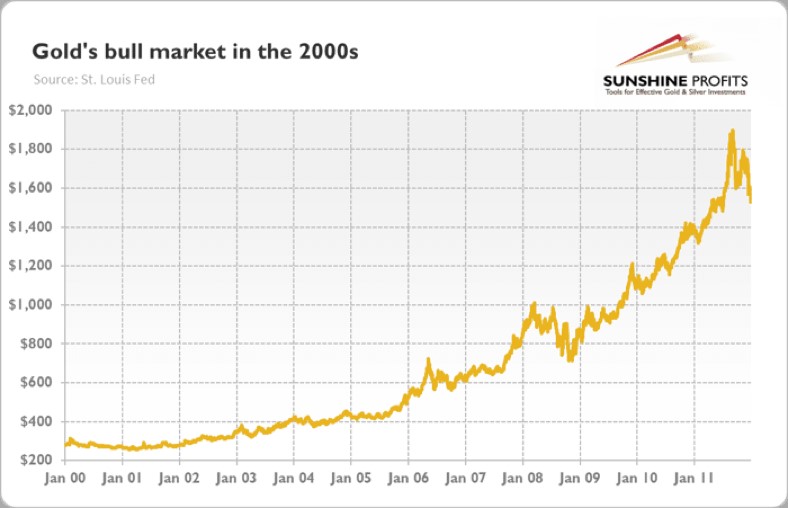
Gold Prices In 2000s.
It then began climbing steadily, though with some important corrections. In 2008 the mortgage crisis morphed into the financial crisis, with the demise of investment bank Lehman Bros., and stocks crashed that fall. Gold dropped $250 over several months as investors cashed in assets to meet margin calls. But gold quickly recuperated, going on to set new highs, and eventually a record high above $1,900 in 2011.
The Fed had to fight what turned out to be the longest recession since World War II, from December 2007 to June 2009. The banking system was reliquefied and the economy reflated by slashing interest rates to near zero for the next several years and large-scale buying of mortgage-backed securities. Because economic activity and unemployment had been so badly hurt, banks were unable to significantly boost lending, which kept inflation very low. Instead, large corporations borrowed cheaply and began major stock buyback programs.
The effect was to shrink outstanding shares, which artificially pushed up earnings per share. That helped consistently push the stock market higher. So, gold retreated between 2011 and 2015, moving sideways until its bottom in December 2015 at $1,050. That was a nearly 50% correction from its 2011 peak above $1,900.
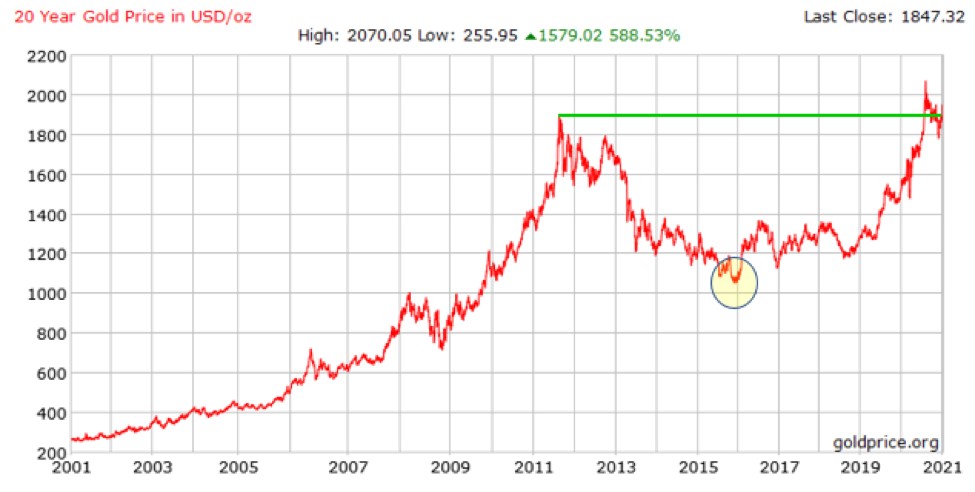
20-Year Gold Chart.
From the above chart, we can clearly see the late 2015 bottom, as well as the recently established new all-time high. In fact, the pull-back of the last few months barely shows up on this longer-term chart.
What’s Driving Current Gold Bull
This next chart is probably the most important to understanding the gold price. It plots real rates versus gold over time.
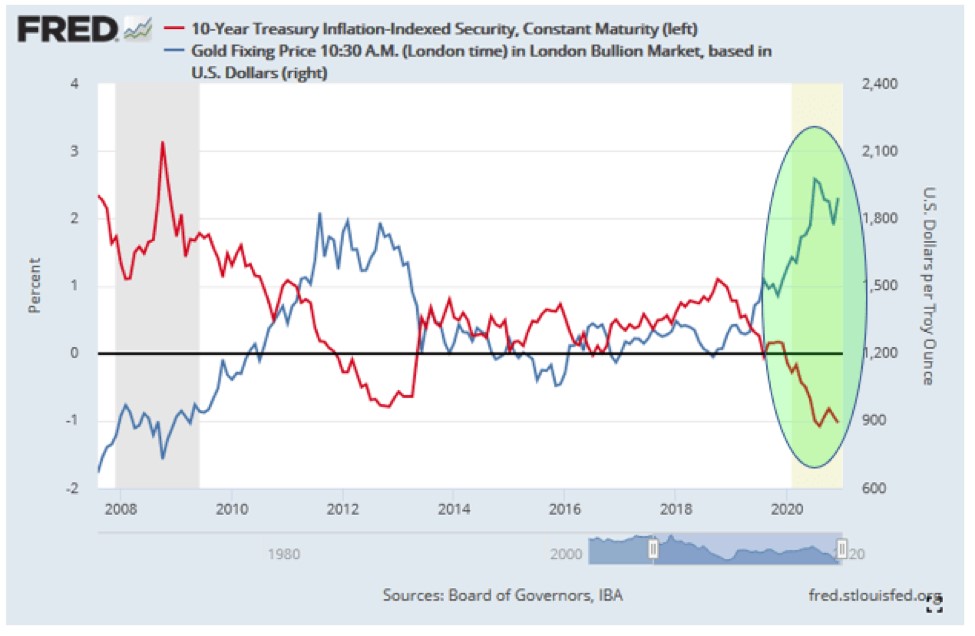
10-Year Treasury And Gold.
We can see that when real rates (10-year treasury rate minus inflation rate) are positive or climbing, gold struggles. But when they are falling or negative, gold performs well. That explains why, since late 2018, gold’s been on a tear, soaring from $1,200 to over $2,000 this past August.
The Fed has promised to keep rates near zero until at least 2023. Yet, with its massive ongoing bond-buying program and trillions in stimulus since the arrival of COVID, inflation has become a looming concern. And with the Democrats controlling the White House, Congress and the Senate, you can be sure spending is only going higher from here. That explains why the market is expecting robust inflation going forward.
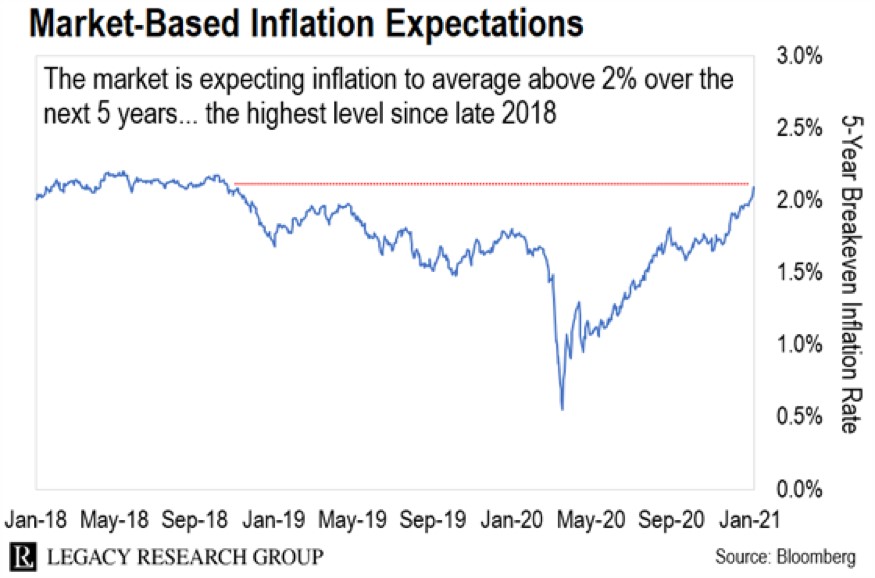
Inflation Expectations.
This combination of near-zero rates and rising inflation all but guarantees negative real interest rates and, therefore, a rising gold price. And despite what official inflation statistics may say, the reality is that so many of the basics, from food to building materials, have been soaring.
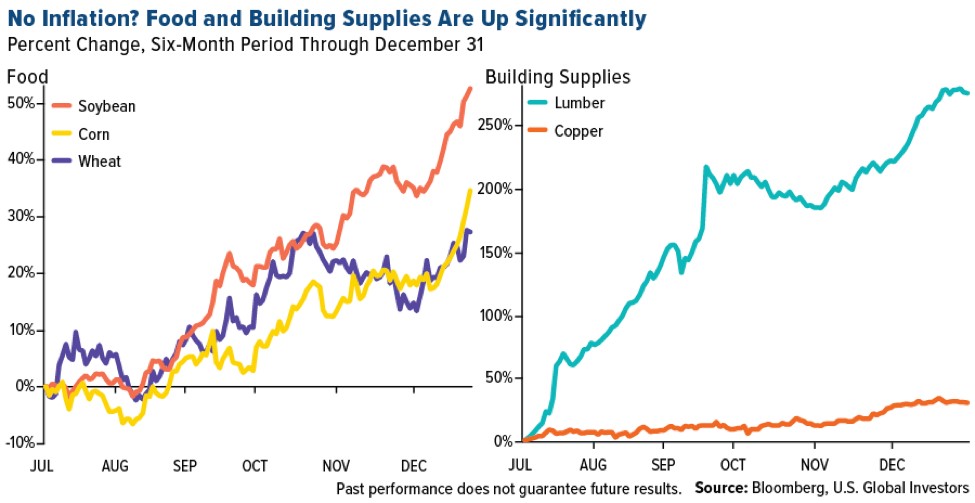
Food And Building Supply Prices.
This is what gold is sensing, and it’s why gold is so crucial to protect your purchasing power and to grow your investment portfolio over the next several years.
But investors do need to consider two important aspects. The first is to be willing to take some profits from an extended rally as gold stocks become overbought, like this past August. The second is to expect volatility, and embrace it. As the gold bull market matures, volatility will increase. Investors need to expect it, and in some cases take advantage by buying into weakness or corrections as the sector becomes oversold, like it is currently.
And here’s one more chart, to give you some perspective on where we probably stand right now.
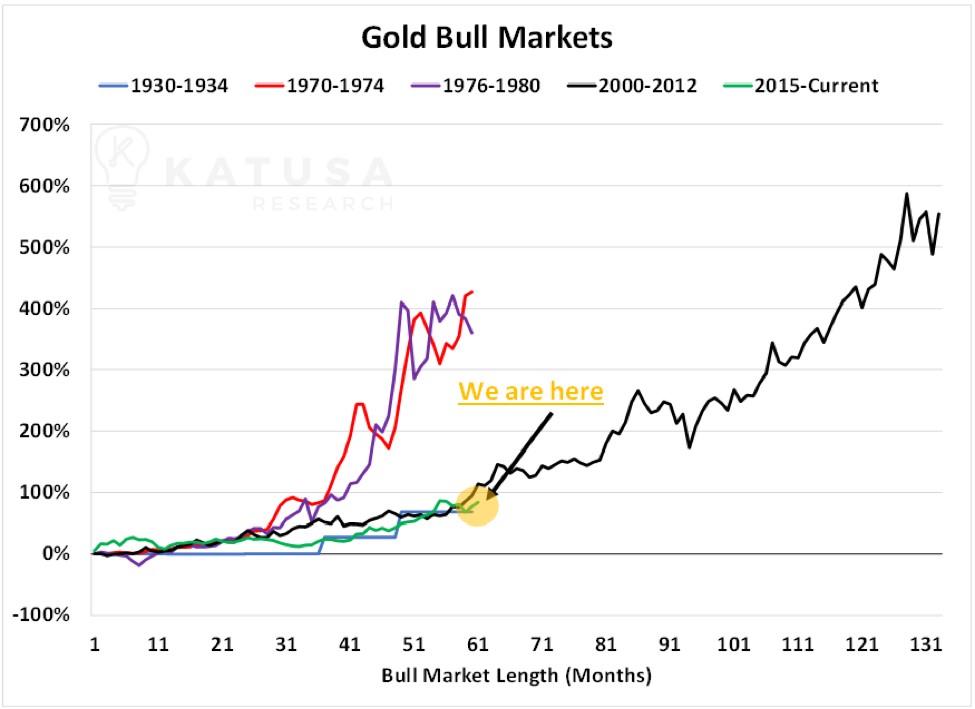
Gold Bull Markets.
Based on previous gold bull markets, gold likely has much, much higher to go before it eventually peaks. That leaves us with plenty of runway to earn big gains from gold investments. I think gold can eventually reach as high as $5,000 per ounce, which should translate into huge gains, even for the larger gold miners.
Right now, the combined market caps of the 10 largest U.S.-listed gold stocks is less than 40% of the value of Facebook (NASDAQ:FB). As investors see gold continue to rise, they will increasingly gravitate to gold stocks as their profits soar. This sector will be explosive.
For now, gold stocks are fundamentally undervalued. In fact they’re one of the few market sectors with the rare combination of little to no debt, low P/E ratios, soaring profits and, in many cases, attractive dividends.
In the Gold Resource (NYSE:GORO) Investor newsletter I provide my outlook on which gold equities offer the best prospects as this bull market progresses. I recently added two new names to the portfolio, which I believe offer exceptional upside potential.
It’s time to gain exposure to the gold sector.
*********


