Gold Busts Year-to-Date Support


Bye-bye 1854-1779 support. Whilst it lasted, 'twas a beautiful thing. But as they say in NASCAR upon a car's engine all going wrong: "It done blowed up!" (Or in this case down). Here's our depiction in the chart of Gold by the day so far this year:
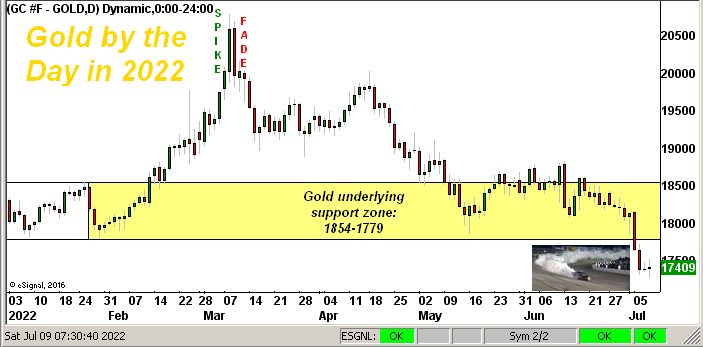
However: Are we that disturbed by this fallout? Perhaps not so much disturbed as a bit wryly surprised. To be sure, price's breaking lower is rather untoward (please no "Dollar strength"/rising rates comments from the low-information crowd). But the drop to this point is not sufficient such as to steer us away from our Gold forecast high for this year of 2254, that target somewhat shy of Mighty Goldman's call in late March for Gold 2500 by year-end, (barring their lowering that objective).
Regardless, Gold settled yesterday (Friday) at 1741, far and away its lowest weekly closing level year-to-date as displayed by the rightmost candle below in our year-over-year chart, the parabolic Short trend still well in force with the red dots having declined for a 15th consecutive week. Not a very pleasing picture at which to gaze there:

So how low may Gold go? If we stick with a "structural support" assessment, the case can be made that Gold remains in a more broadly-based 1920-1678 zone, (which admittedly spanning a high-to-low range of -13% is a bit suspect to label as "support"). Thus more meaningfully, let's just say we don't wish to see last year's 09 August low of 1678 go.
Still, in honestly acknowledging Gold's declining price, we've this from the "Been There, Done That Dept." For yet again we find Gold being naively negotiated as a commodity rather than as the currency it is. And thus, as the dazzling Dollar continues to get "the bid", other of our markets, namely Copper, Silver, Gold and notably Oil -- all commodities in the eyes of the ignorant -- are getting summarily whacked.
"Well, ya knooow, here at the firm we just trade 'em all as bundle, right?"
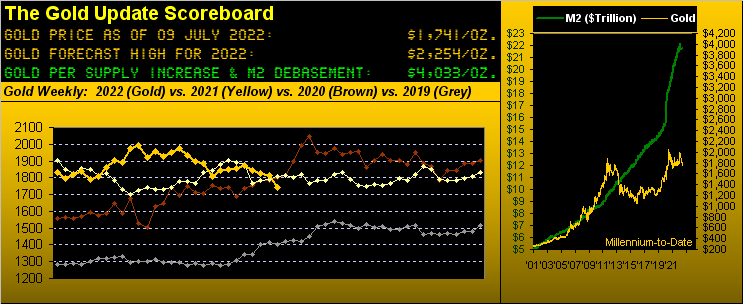
Fairly stupefying to hear that, to lump in the precious metals as no different than pork bellies, ("Do we get fries with that?") Regardless with Gold priced today at 1741 'tis but 43% of our Scoreboard valuation of 4033. 'Tis akin to purchasing the median-priced U.S. house for a scant $161k, a new Porsche 911 Targa at Zuffenhausen for a wee €51k, or a Big Mac in London for an appetizing £1.37 ... analogous as always to the market never being wrong, but materially misvalued were those impossibly low prices actually charged. But then there we are today with Gold priced impossibly low. The good news is in having tracked the yellow metal by its Dollar debasement valuation since 1980 (thank you St. Louis Fed), the price of Gold -- even if lagging -- has eventually caught up to a maximum debasement value: it just hasn't happened since October 2011, when indeed we penned that Gold had "gotten ahead of itself". And with today's Scoreboard debasement value +132% higher at 4033: "Where else would you rather be?" --[Buffalo Bills Former Head Coach Marv Levy].
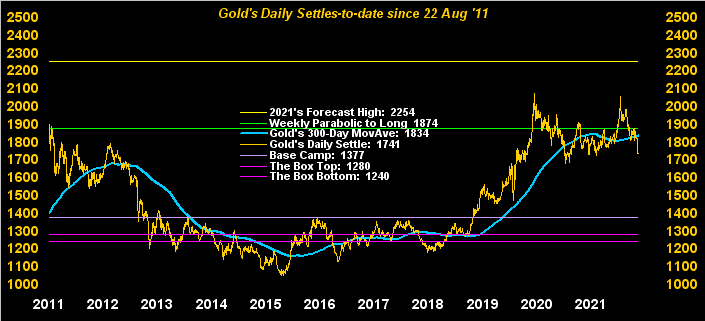
Meanwhile as we next go to Gold's daily settles from 22 August 2011-to-date (1900 -> 1741 = -8% versus the U.S. "M2" Money Supply's $9.5T -> $21.8T = +129%), therein price has just swiftly sunk back below the 300-day moving average. Such deviation is typical of that witnessed when having occurred in recent years, suggestive of this selling near ending; (let's just not have a 2012-2015 repeat):
And now to the Economic Barometer -- which in spite of a "strong" (yesterday's FinMedia adjective) StateSide June Payrolls report -- is now (even as an oscillator) at an 18-month low.
"An illusion, mmb? But the market is never wrong..."
'Tisn't wrong a wit, Squire. The S&P 500's current level of 3899 is its capitalized-weighting indexing of all 503 constituents as shoved to and fro. But as you regular readers all too well know, the earnings underlying many-a-constituent's price are, on balance, quite lacking via to the historical norm, with yields relatively unattractive versus those from the debt market. Further with Q2 Earnings Season now kicking into gear, it shan't be pretty. For example, next week we count 11 entities of the banking industry to report for Q2: only three by consensus are "estimated" have bettered earnings over Q2 of a year ago.
"But mmb, that's already priced in..."
Squire, we're nowhere yet near "priced in". The Econ Baro continues to plummet, Fed-Atlanta (nearly a year behind) sees confirmation of recession come 28 July, five-year dough yields double that of the S&P, and should earnings not grow and the "live" S&P's price/earning ratio (30.8x) again revert to its historical mean (22.3x) that places the Index at 2823, (should you be scoring at home). First however, let's deal with the oft-noted S&P 3600-3200 "critical support zone" coming to a quotation screen near you.
Yet, 'tis not all bad: for May, growth in Factory Orders picked up, Wholesale Inventories worked down, and the Trade Deficit was reduced, (how's that "Dollar strength" workin' out for ya?) But the month's Consumer Credit was sharply lower, growth in June's Hourly Earnings slowed (how's that "inflation" workin' out for ya?), Average Workweek hours were reduced, and as to the aforementioned "strong" Payrolls data, they actually were a bit less than May's net creation, which itself was revised lower from April, (but we're not supposed to cite that).
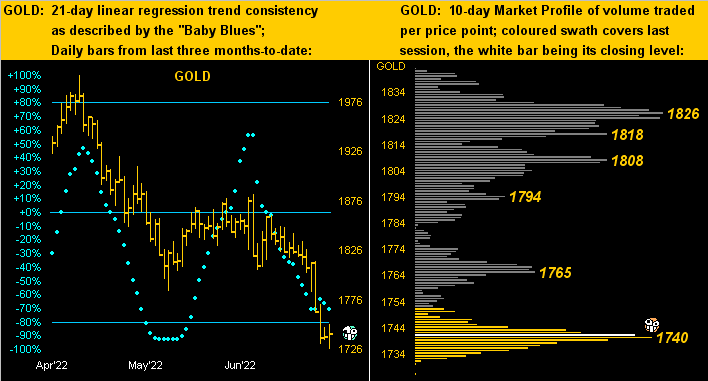
Notwithstanding, we next cite Gold's poor price presentation via our two-panel graphic of the last three months by the day on the left and 10-day Market Profile on the right. Butt-ugly by both boxes:
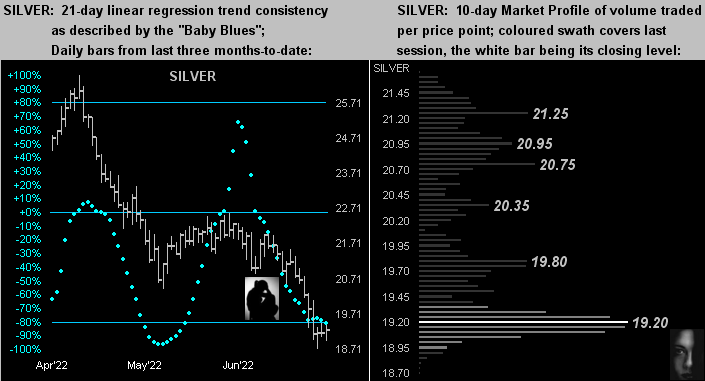
And as for Silver's like two-panel display, can it get any worse? Today at 19.24 with the Gold/Silver ratio way up to 90.5x, revert to its century-to-date mean of 66.8x and that alone pops price +29% to 27.14. Our collective {sigh} for Sister Silver...
Peeking into next week's incoming Econ Baro metrics, yes "inflation" shall be getting the headlines. But come Friday is the University of "Go Blue!" Michigan Sentiment Survey which is called to be sub-50 for the first time ever! Its highest reading was 112 as reported on 28 January 2000 when everyone was celebrating being in the 21st Century a year early; the S&P -- then 1360 -- is today +187% higher at the aforementioned 3899. But the Sentiment Survey as measured from then is now set to read some -56% lower. Yet another one of those things that makes you go "Hmmmmmmm..." Got some Gold?
Cheers!
...m...
www.deMeadville.com
www.TheGoldUpdate.com
********

Mark Mead Baillie has had an extensive business career beginning in banking and financial services for two years with Banque Nationale de Paris to corporate research for three years at Barclays Bank and then for six years as an analyst and corporate lender with Société Générale.
For the last 22 years he has expanded his financial expertise by creating his own financial services company, de Meadville International, which comprehensively follows his BEGOS complex of markets (Bond/Euro/Gold/Oil/S&P) and the trading of the futures therein. He is recognized within the financial community of demonstrating creative technical skills that surpass industry standards toward making highly informed market assessments and his work is featured in Merrill Lynch Wealth Management client presentations. He has adapted such skills into becoming the popular author each week of the prolific “The Gold Update” and is known in the financial website community as “mmb” and “deMeadville”.
Mr. Baillie holds a BS in Business from the University of Southern California and an MBA in Finance from Golden Gate University.


