Gold Clearly Reverses At Consolidation’s Upper Border


Quite a few journalists wrote about gold’s breakout in the previous days even though gold made an attempt to break above the key resistance – the mid-2013 high – only today (and it failed). At the same time, when the gold to silver ratio was breaking out in a clear way, many journalists ignored that and emphasized the importance of the resistance at hand. Either way, the focus was not on what was really going on, but on trying to make the reality fit the bullish case for gold. After all, “gold people” have to be bullish on gold all the time, right? Wrong – those, who want their clients to succeed need to stay focused on what is likely to happen based on objective, cold logic and facts, instead of chasing the emotions of the day. And what do the facts tell us?
We have a twofold purpose in highlighting the pitfalls of perma-bullish emotionality. The first one is to show you how acting on emotions in investing backfires – gold rallied temporarily above $1,440 and in today’s pre-market trading, declined to almost $1,400. And it doesn’t seem that the decline is over. The second one is that we want to emphasize that there is almost nobody else in the gold analysis business that saw that the real resistance and the upper border of the long-term consolidation pattern in gold is at the mid-2013 highs. Many others cheered as gold moved above the previous – less important – highs, and they wrote about a major breakout in gold. These were breakouts, but not the key ones and nothing to call home about given that the highest of the relatively close highs remained unbroken. Please remember the above as gold moves to lower prices. Please also remember that we are writing right now that we will see gold below $1,200 well before we’ll see it above $1,500.
Let’s see what happened on the precious metals market, starting with something… beautiful.
Marvelous Fractal Lessons
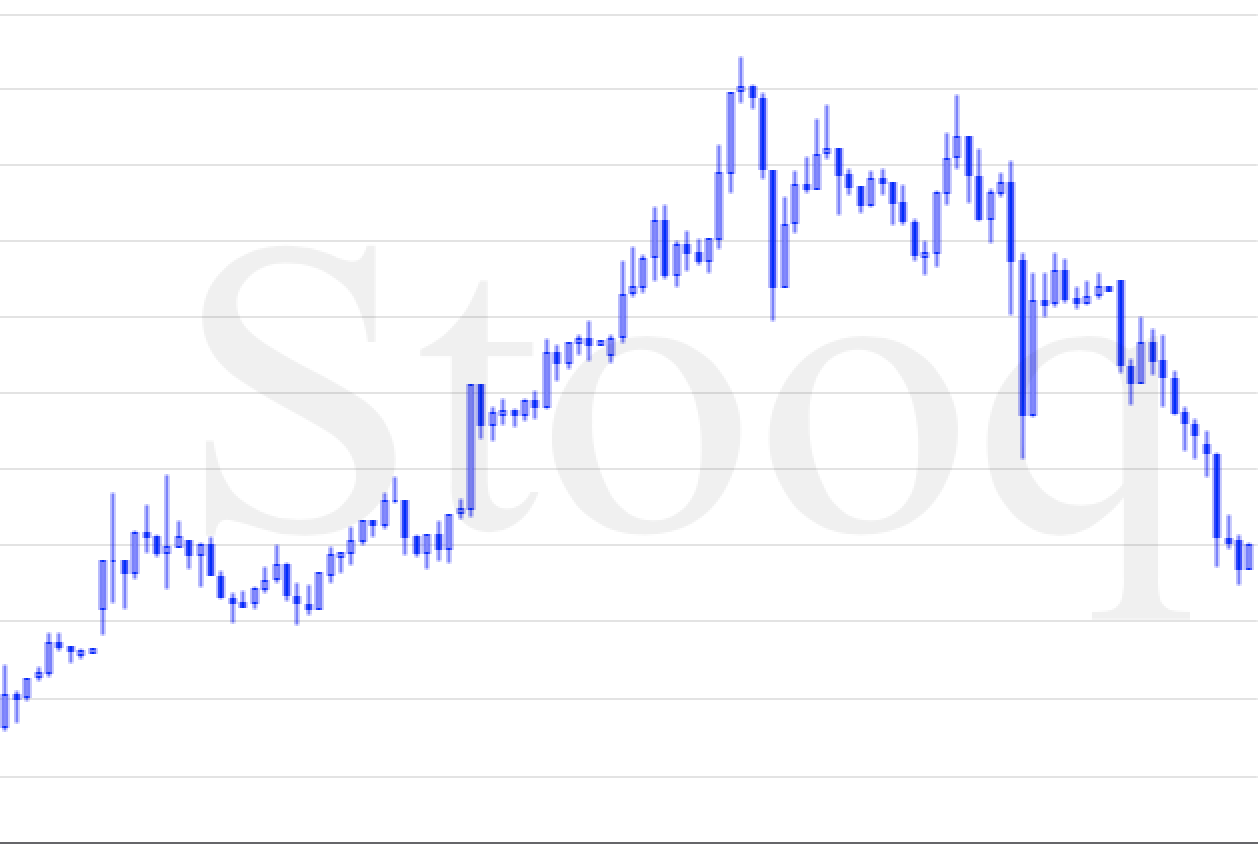
Do you remember how gold topped in 2011? Do you recall its immediate and sharp decline followed by a correction that hasn’t made it to the previous high, and then – after a few months of pausing – making a final attempt to move higher but failing to break above the most recent high? And then, in April 2013, it truly plunged, which was immediately followed by a sharp correction and then the slide continued to new lows?
If you’ve been interested in the precious metals market at that time, you definitely remember – it was impossible to miss these moves.
The beautiful thing here is that… The above chart doesn’t feature it. These are not weekly or monthly candlesticks. These are 30-minute candlesticks and what you see above is what gold did in the last two days or so. You probably thought that it was gold’s performance from 2013, because the price pattern is almost identical. Please take a look below for details.
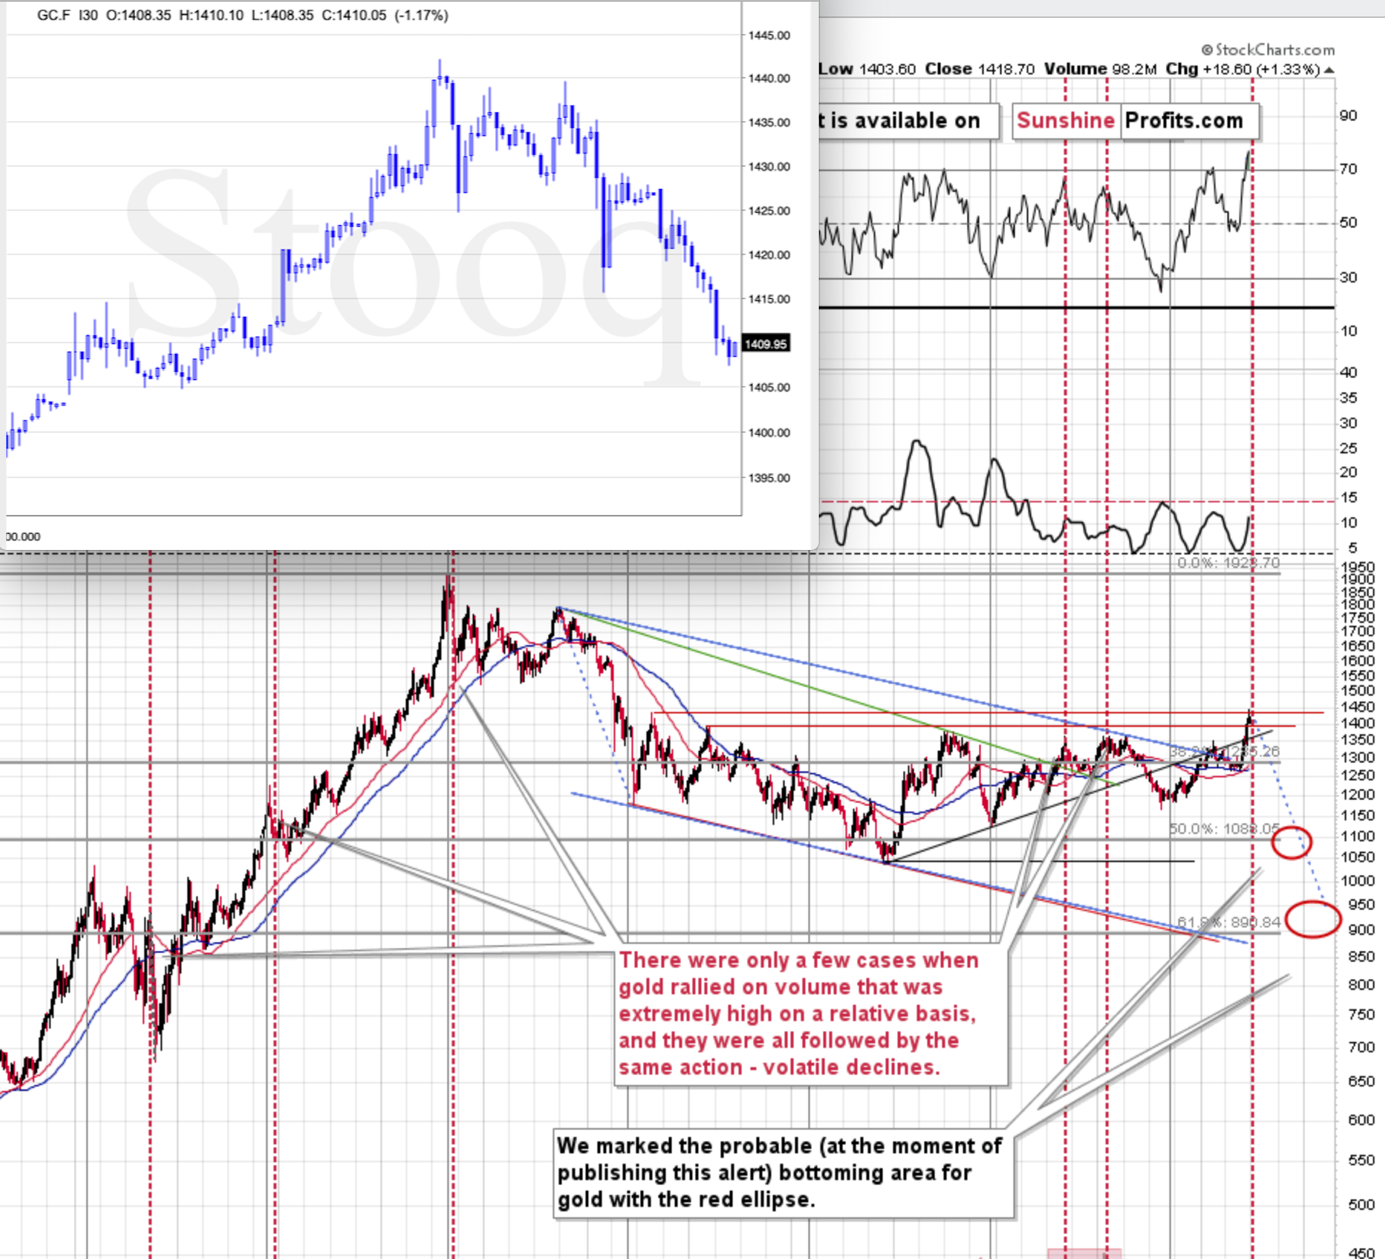
Entirely different time frames, entirely different candlestick length, and yet, the pattern repeated itself almost to the letter. The fractal near-perfection.
We detected it during yesterday’s session, but since it simply confirmed what we wrote in our regular gold and silver trading Alert, we didn’t send an intraday follow-up. What does it mean going forward?
The similarity is likely to persist for some time. Unfortunately, we don’t know for how long it’s going to be the case, but it’s definitely likely to remain in place for a day or two. Given the current volatility, a day or two can change quite a lot, so the above is important. What happened after the 2013 slide? Gold entered a few-years-long consolidation. Applying it to this week’s terms, it means that we could see some back and forth trading today or tomorrow. This could be accompanied by another move lower in the USD Index, during which it reaches its 61.8% Fibonacci retracement level. Or it could be more or less random, or Twitter-politics based.
What the above doesn’t tell us is what happens after the one- or two-day consolidation, and if gold is done declining in case of this immediate-term move. The volatility has been extraordinary recently, which means that gold could slide some more before today’s daily bottom is reached. It might be the case that gold slides below $1,400 and then consolidates. This would complete the analogy to the long-term price pattern.
And this is where things are likely to get really interesting. You see, the fractal similarity works both ways. Gold’s small (it could be just several hours) consolidation and a daily close below $1,400 could result in a powerful slide in the following hours (possibly tomorrow). Yesterday, we mentioned this week being critical, as it’s where we’ll get also the monthly and quarterly closing prices, which are paramount. This means that if the bearish picture remains intact, we should see a decline before the end of the week and that’s more or less what we’re getting right now. Let’s move back to the similarity. If gold plunges in the following days and weeks, it will also indicate what gold is about to do from the long-term point of view – in the following months. Please assess gold’s performance with regard to the overall volatility – it should provide a taste of what’s to come (multiplied many times in terms of price and time).
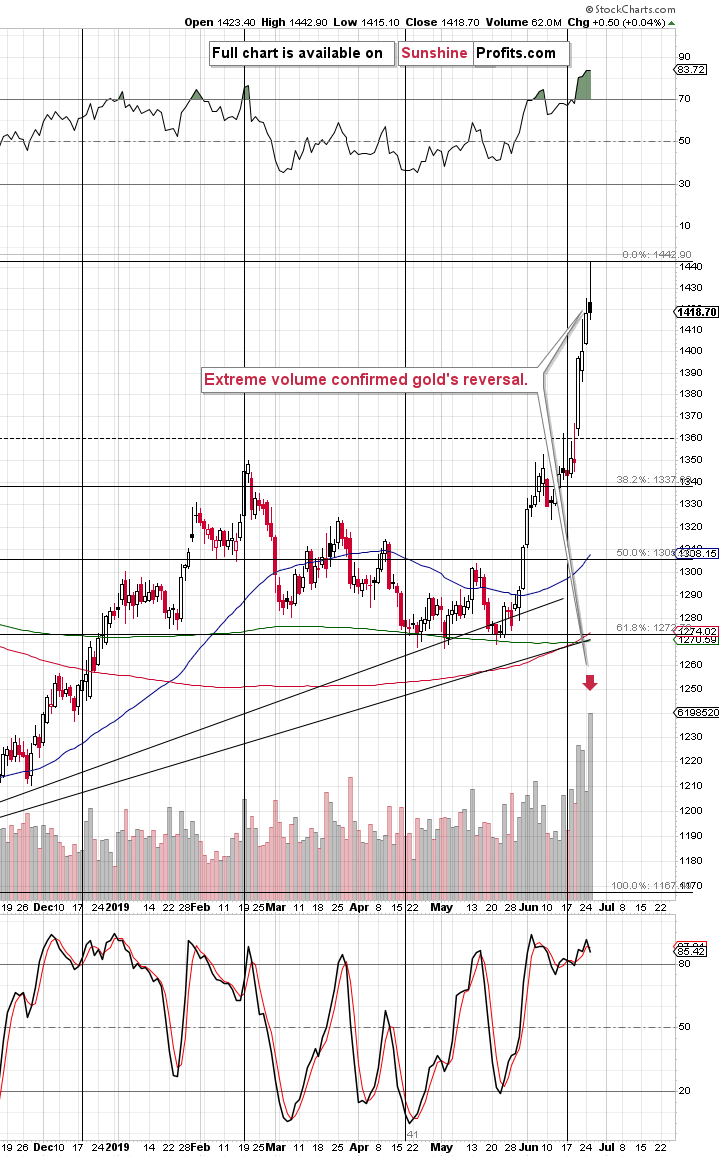
As far as the daily chart is concerned, we saw a near-perfect gold shooting star reversal. The critical thing to look for during these reversals is volume. We should see the fierce battle between bulls and bears, leaving the bulls overpowered. Low volume means that the battle was not fierce, or that there was very little fighting done on a given day. The implications would likely be nonexistent. But, that’s not what happened yesterday. We saw the highest volume of 2019. And it happened while RSI was not only above 70, but above 80. And it happened at the combination of three vertex-reversals. It really doesn’t get any more bearish than that – it’s a classic beginners-gold-trading-guide combination of bearish signals that should be obvious to everyone.
What About Silver?
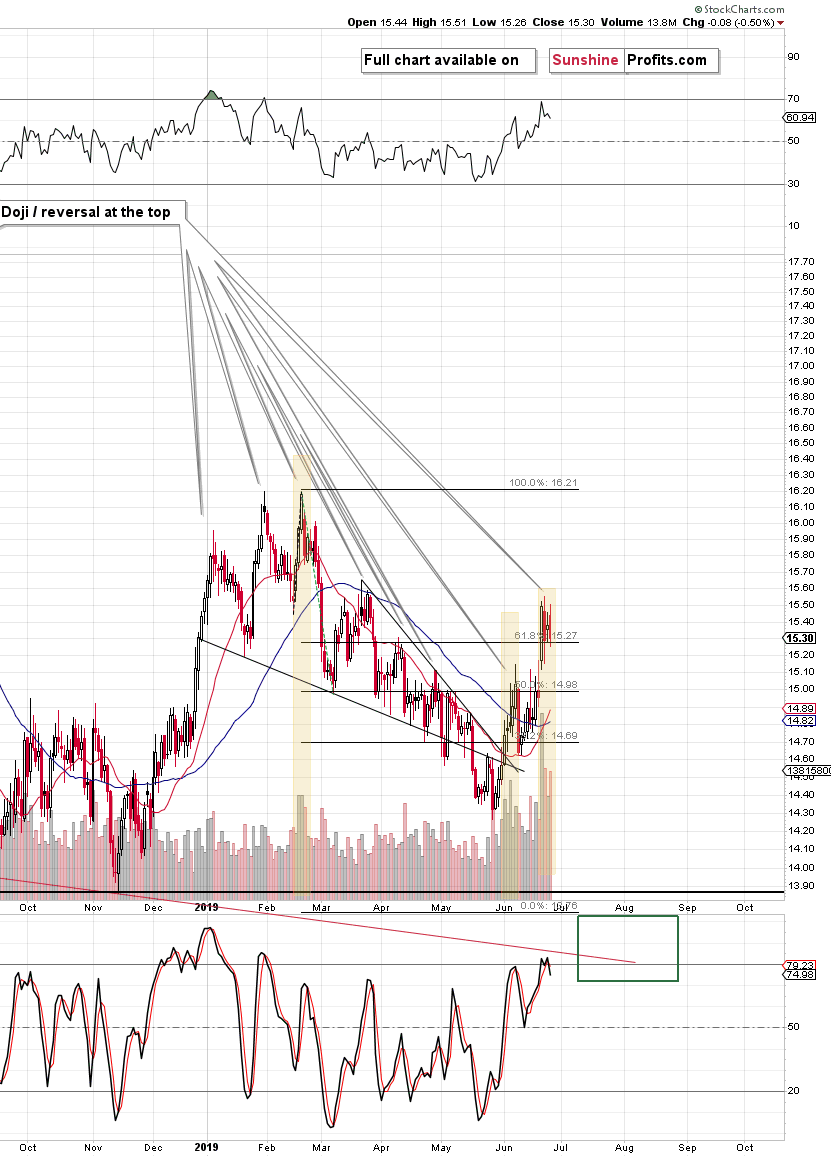
Silver topped in a classic manner – it moved higher on extremely high volume, while outperforming gold at the top. It then refused to follow gold higher, but the key thing remains that there was a time during which the silver market outperformed – this was the true top.
The yellow rectangles on the above chart mark the situations in which silver soared on huge volume. They were all tops, but the early June case was just a local, not the final top. The size of the volume that we saw recently suggests that there will be no additional attempt to move higher anytime soon and that this was indeed the final high.
The RSI moved to 70, additionally confirming that the top is indeed in.
Summing up, the gold-silver ratio, silver itself, gold stocks to gold ratio, the size of the upswing in the gold stocks, and the situation in the USD Index, and gold’s invalidation of the breakout above the mid-2013 high all suggest that the most recent move higher in the precious metals sector is nothing more than just a corrective upswing within a bigger trend. It is only the gold price itself that can make one wonder if gold has truly broken out and that it will now continue to soar. This is doubtful, because this strength is not confirmed, as it happened right after a series of rather chaotic and surprising news. Adding extremely positive sentiment as confirmed by volume across the precious metals board and the very strong triple vertex-based reversal indication, makes the outlook for gold much less bullish that everyone and their brother would have you believe. Please note that we are not “married” to the bearish outlook for gold and we will return to viewing the medium-term outlook as bullish, but not until the cold analytical facts suggest that the tables have indeed turned. This is not the case right now – please take a look at today’s charts for details. In particular, it’s a bad idea to adjust one’s outlook just because many people got excited. The excitement itself is a sign of a turnaround, not something to take at face value.
Today's article is a small sample of what our subscribers enjoy on a daily basis. They know about both the market changes and our trading position changes exactly when they happen. Apart from the above, we've also shared with them the detailed analysis of the miners and the USD Index outlook as they both carry numerous implications for the PMs market.. Check more of our free articles on our website, including this one – just drop by and have a look. We encourage you to sign up for our daily newsletter, too - it's free and if you don't like it, you can unsubscribe with just 2 clicks. You'll also get 7 days of free access to our premium daily Gold & Silver Trading Alerts to get a taste of all our care. Sign up for the free newsletter today!
Przemyslaw Radomski, CFA
Editor-in-chief, Gold & Silver Fund Manager
Sunshine Profits - Effective Investments through Diligence and Care
* * * * *
All essays, research and information found above represent analyses and opinions of Przemyslaw Radomski, CFA and Sunshine Profits' associates only. As such, it may prove wrong and be a subject to change without notice. Opinions and analyses were based on data available to authors of respective essays at the time of writing. Although the information provided above is based on careful research and sources that are believed to be accurate, Przemyslaw Radomski, CFA and his associates do not guarantee the accuracy or thoroughness of the data or information reported. The opinions published above are neither an offer nor a recommendation to purchase or sell any securities. Mr. Radomski is not a Registered Securities Advisor. By reading Przemyslaw Radomski's, CFA reports you fully agree that he will not be held responsible or liable for any decisions you make regarding any information provided in these reports. Investing, trading and speculation in any financial markets may involve high risk of loss. Przemyslaw Radomski, CFA, Sunshine Profits' employees and affiliates as well as members of their families may have a short or long position in any securities, including those mentioned in any of the reports or essays, and may make additional purchases and/or sales of those securities without notice.
********
 Przemyslaw Radomski, CFA, is the founder, owner and the main editor of SunshineProfits.com. You can reach Przemyslaw at: http://www.sunshineprofits.com/help/contact-us/.


