Gold Completes Another Nowhere Week, BUT...
 share
share
 share
share
 share
share
 share
share
 share
share
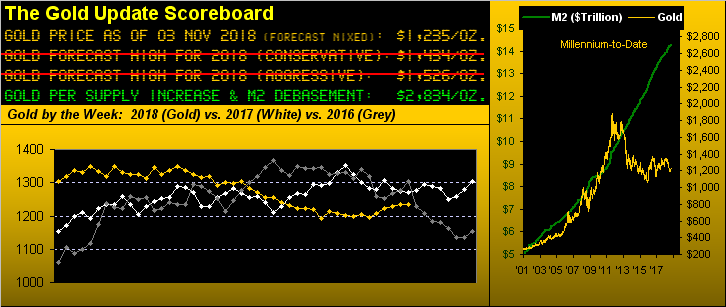
Gold's last three weekly settles have respectively been: 1230, 1236, and now yesterday (Friday) at 1235. Moreover, gold has settled in the 1230s for eight of the last 11 trading days. "BUT"...
Come Tuesday's StateSide election results during which the late-night financial world shall be fixated upon gold and the S&P futures wildly reacting into Wednesday's wee hours and onward, we'll likely be cueing Dorothy Gale's famous line that "Toto, we're not in Kansas anymore."
Let's review, first with the S&P as it (compared to docile gold) is where the real drama shall be. From the election night of 08 November 2016 (for which the trade date was already 09 November), the S&P futures swung through a range of 138 points: that was seven times the "expected daily trading range" (EDTR) for that date of 19 points. Come the election results this Tuesday/Wednesday, should a similar swing phenomena occur and given that today's EDTR is running at 61 points, seven times that is 427 points... 'Course, that would get largely mitigated by the imposed overnight futures "lock limit" of 5% which at this writing would be a mere 136 points in either direction; (by day, it can then get to 20%, downside only, which would be some 544 points, in turn bringing the S&P within a whisker of our overall 2154 correction target, i.e. the full elimination of the present President's rally-to-date).
Here is the same drill for gold. Its election night swing from 2016 was a full 70 points (from 1338 on Hillary High Hopes down to 1268 on Donald Did It) which was five times the EDTR then of 15 points. Now two years hence with gold actually lower than 'twas then and the current EDTR being just 13 points, should Congressional power shift left, Gold ought shift up and get above The Box (1240-1280). Should Congressional power stay right, gold ought shift down and fumble about in the upper 1180s. Either way, look for price to escape this recent drudgery of the 1230s, (aka "Kansas"). Here are the weekly bars, the blue dots of parabolic Long trend nonetheless accelerating their ascent, "BUT":

Staying with this time frame from a year ago-to-date, here we've gold's percentage track (-7%) along with those for its more suffering equities brethren, namely Newmont Mining (NEM -11%), the VanEck Vectors Gold Miners exchange-traded fund (GDX -13%), Franco-Nevada (FNV -19%), the Global X Silver Miners exchange-traded fund (SIL -24%), and beaten-down Goldcorp (GG -26%), albeit this bunch has most recently sprung up, arguably on safe space pre-election jitters:
And with 10 trading months plus two days now in the books for 2018, here are our year-to-date BEGOS Markets Standings, led we believe for the first time by the non-BEGOS component Dollar Index. Well, that tells the whole story, non?
Meanwhile we're fairly convinced that Federal Reverse Bank ex-Chair Janet Yellen never really learned her lesson to mind the Economic Barometer, her stating this past week that interest rates ought be further raised. The Baro did have a bit of a whipsaw week, benefitting from reports on inflation measures, payroll creation and Consumer Confidence; but the dirty little negatives ran their course as well, as the Trade Deficit grew, Truck Sales fell as did the Institute for Supply Management's Manufacturing Index, plus came slowing in Factory Orders, in Construction Spending, in Q3's read on Productivity, and in both Personal Spending and Income despite results from the National Association for Business Economics citing wage increases are at record high levels. Here's the whole picture (which does not include the EuroZone's growth slowing to a pace not seen for four years, nor that StateSide debt issued this year shall be the most since 2010):
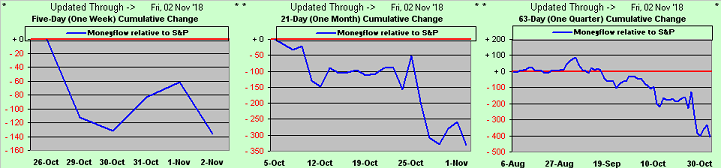
Important Observation: whilst our bailiwick is gold, given the pending post-Tuesday "move" in the S&P, 'twould be a disservice to not maintain that vein for a moment. Look at the following chart from the website: the three blue lines from left-to-right which cover the past week, month and quarter show the difference between the respective points changes in the S&P 500 and its moneyflow regressed into S&P points. So what we've got is far more money flowing out of the S&P than is belied by the Index itself. The suggestion is, again from left-to-right, that the S&P for the past week "ought be" some 130 points lower than 'tis, or more than 300 points lower based on the past month, or 400 points lower based on the past three months. And as earlier noted, ("lock limits" notwithstanding) a -20% move toward the neighbourhood of our correction call would be largely achieved in compensating for that 400-point mismatch. Just sayin'...
This kind of moneyflow leaving the building is supportive of ole Ralph "I Gotta Say It" Acampora duly noting this past week that the state of the stock market is worse than investors realize. In fact, we chuckled at this comment from a FinMedia radio reporter that "... despite the rallying over the last few days, we saw stock indices down in October..." That's obviously from someone who hasn't been around very long. But then came this from someone who has: James Cramer reportedly stated that "...this market is reminiscent of the worst crashes I’ve ever seen..." Good grief, Jimbo, the S&P from its all-time high of 2941 on 22 September down to last Monday's low of 2604 is but a wee -11% all-in move; forget thee not the two -50% moves in 2000-2002 and in 2007-2009 (!) We're just gettin' started even if the balance of Congressional power doesn't change. (Write it down).
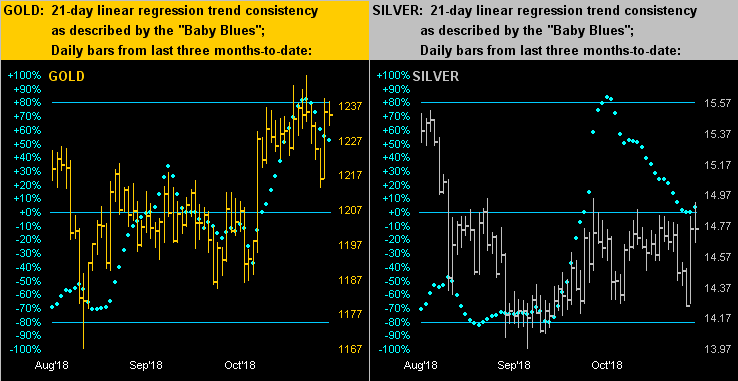
Back to the precious metals and specifically their performance from three months ago-to-date. On the left we've gold, which as you know meandered up essentially to the base of The Box (1240-1280) before having since run out of puff, the elections nonetheless in the balance; gold's baby blue dots of linear regression trend consistency now in decline after having been above the +80% axis generally portends lower price levels, (but the elections remain the "BUT"). On the right we've Silver attempting to refute her descending Baby Blues; remember, the Gold/Silver ratio still sitting above 80x ought bode very well for the white metal's inevitable upward growth over that of the yellow metal:
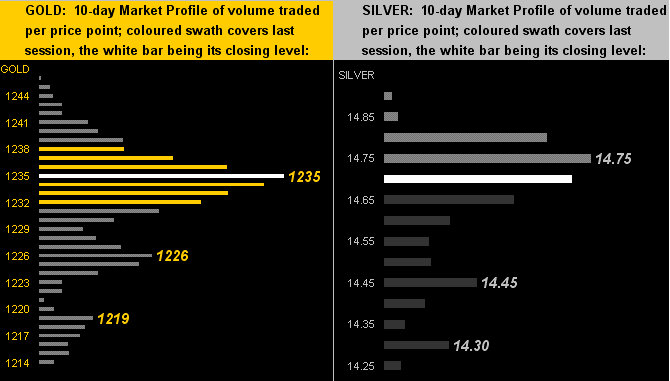
Now per its 10-day Market Profile, lets look at where gold (below left) settled out its week: smack on 1235, the most heavily-traded price of the past two weeks. And 'tis almost the same for Sister Silver (below right) just under her 14.75 level. Pre-election perfection, precisely timed for the "BUT":
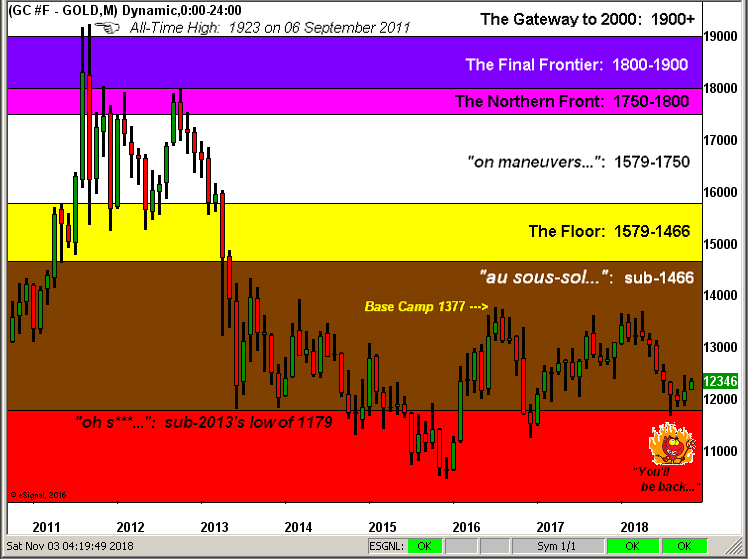
Finally, the calendar having flipped to November, here is Gold's Structure with its defined strata as measured by the month since 2011. Note that from this year's April through September gold recorded six consecutive down months; you'll recall that a seventh straight down month has never been recorded since at least as far back as Nixon's nixing of the Gold Standard; and thus it came to pass that October was an up month, and thus far, per the rightmost bar, is ever so young November. "BUT":
So there 'tis "BUT" with the StateSide elections in the balance. Does anybody realize that the Federal Open Market Committee meets as well this coming Wednesday/Thursday? Lucky Chairman Powell does not have to pontificate in a post-Policy Statement press conference whilst the nation endures its election hangover. Regardless of how it shakes out, and with an eye on the subsequent socio-cultural fallout, stay firm with respect to these two truths:
■ The S&P 500 (presently 2723) remains at least 50% higher than our "live" price/earnings ratio of 43.6x suggests it ought be, warranting at least an "all-in" 27% correction from September's 2941 down to 2154 which is a centered, structural support price from the date of the 2016 Presidential election; and
■ Gold (presently 1235) remains at least 50% lower than our currency-debased level of 2834 suggests, that level even taking into account the increase in the supply of gold throughout this millennium; we regularly harp on this, of course, "BUT" in time it will out, and you'll be glad you have gold!
share
share
share
share
share

Mark Mead Baillie has had an extensive business career beginning in banking and financial services for two years with Banque Nationale de Paris to corporate research for three years at Barclays Bank and then for six years as an analyst and corporate lender with Société Générale.
For the last 22 years he has expanded his financial expertise by creating his own financial services company, de Meadville International, which comprehensively follows his BEGOS complex of markets (Bond/Euro/Gold/Oil/S&P) and the trading of the futures therein. He is recognized within the financial community of demonstrating creative technical skills that surpass industry standards toward making highly informed market assessments and his work is featured in Merrill Lynch Wealth Management client presentations. He has adapted such skills into becoming the popular author each week of the prolific “The Gold Update” and is known in the financial website community as “mmb” and “deMeadville”.
Mr. Baillie holds a BS in Business from the University of Southern California and an MBA in Finance from Golden Gate University.


