Gold In Consolidation - Prepping For Next Bull Run


Last week's trading saw gold forming its low in Monday's session, here doing so with the tag of the 1484.60 figure (April, 2020 contract). From there, a slingshot higher was seen into Wednesday, with the metal running all the way up to a peak of 1699.30 - before selling down off the same into Friday.
Gold, Bigger Picture
For the mid-term picture, as mentioned in prior articles, the overall viewpoint for the gold market supports the idea of bullishness into later this year, though with the normal up-and-down gyrations in-between. In terms of price, we are looking for the metal to eventually reach the 1800-2000 level - but with the higher figure being ideal.
Going further with the above, from a late-year high, we will need to be on the hard lookout for technical evidence of the next major top forming - which is expected to give way to a multi-month decline into the Spring of 2021.
The larger upward phase is due mainly to the configuration of the four-year cycle, which is shown again on the chart below:
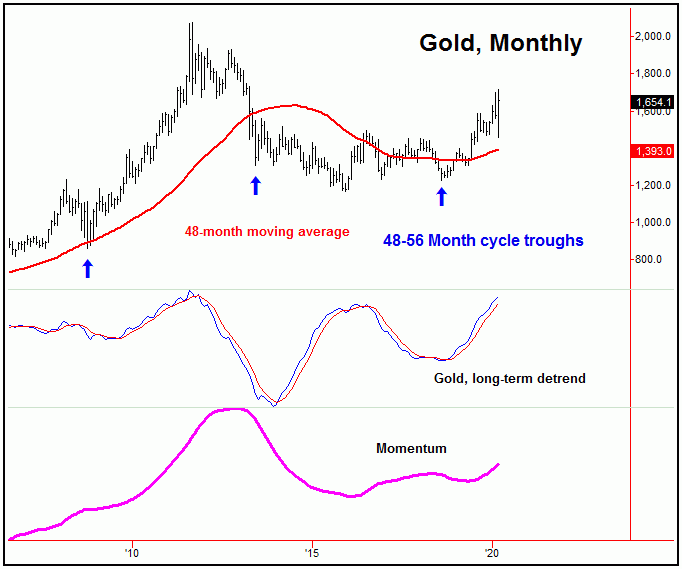
With the above chart, we can see that both our detrend and momentum indicators are pointing to the upside at the present time, and with that the upward phase of this wave should remain in force into later this year. From there, the probabilities will favor a minimum correction back to the 48-month moving average in the months to follow, though that move is currently favored to end up as a larger countertrend affair.
Gold, Short-Term
For the short-term, the 10-day cycle is currently dominating the action, with that cycle shown again on the chart below:
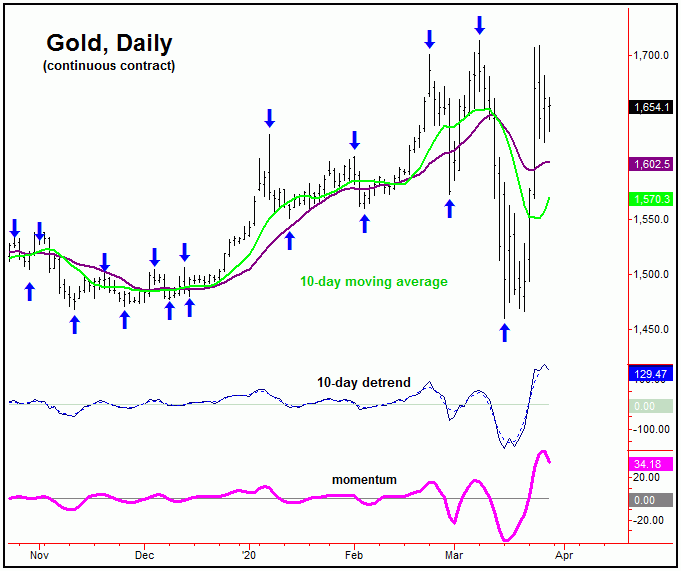
From last weekend: "its (10-day cycle) next peak is due to materialize at anytime. Until proven otherwise, however, the current upward phase of this 10-day cycle is favored to end up as a countertrend affair. If correct, then the probabilities will favor another drop back to or below the lows again on the next swing down, then to be on the technical lookout for the next semi-important trough."
As mentioned, this 10-day cycle is now dominating the short-term action, with this wave last topping with the tag of the 1699.30 figure on Wednesday - and with that is heading lower at the present time. Its next bottom is due to materialize this week, with the same now favored to end up as countertrend - against the 1460.00 figure, the prior labeled low for this component. (Note: We now move to the June, 2020 contract for our latest numbers).
In terms of patterns, the last rally phase of the 10-day cycle was expected to end up as countertrend - as it did do - holding below the March 9th swing top, and made right into our expected 'kill zone' (i.e., the time/price level that killed that rally).
Going further with the above, the expectation was that a countertrend rally with the 10-day cycle would give way to lower lows on the next swing down - which I do not think we will now see, due to a turn up in breadth. Take a look at our next chart:
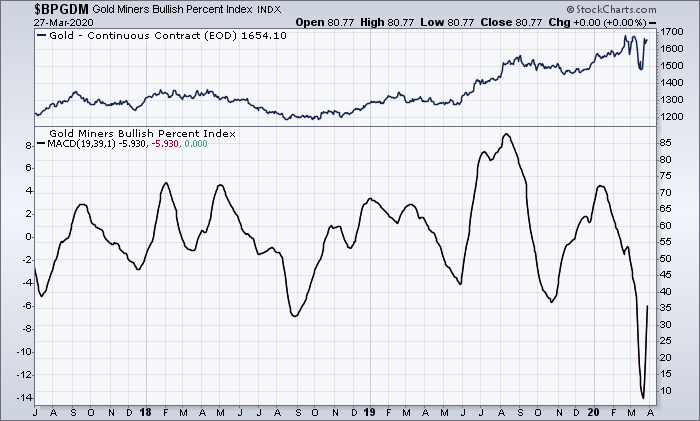
The chart above is a good mid-term breadth indicator for the gold market, created from the gold miners bullish percent index. This indicator will turn following key troughs for the metal, which it managed to do so with the action into mid-week, last week. With that, I view the current configuration of this indicator as a bullish indication, at least until otherwise reversed.
Adding to the notes above, the turn higher in breadth should favor the current decline phase of the 10-day wave to end up as countertrend. More precise details of how the next trough for this cycle will play out - are noted in our thrice-weekly Gold Wave Trader market letter.
Take a look at the next chart, which shows our 72-day cycle:
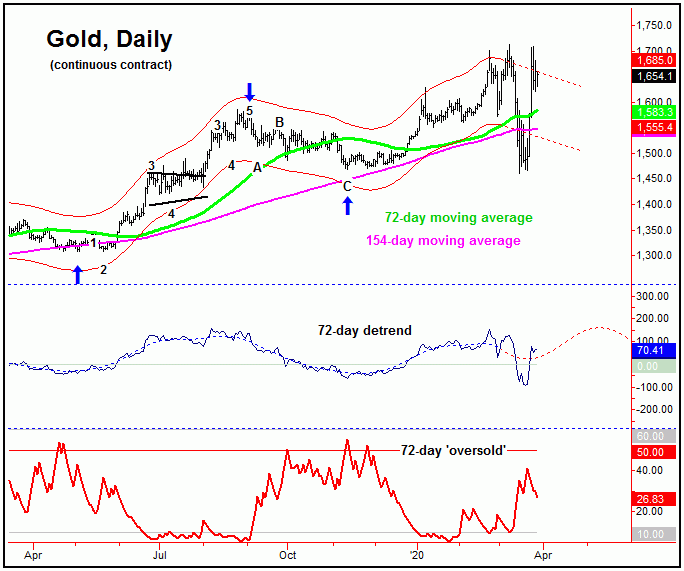
With the action seen last week - and with the new turn up in breadth - our 72-day cycle may have already seen its low. Having said that, the one thing that I really wanted to see with the recent decline was for our 72-day 'oversold' indicator to move above its upper reference line - something normally seen as this wave bottoms out. Maybe we could still get this in the next week or two, on a potential secondary low.
U.S. Stock Market
From the comments made in recent articles, the last low of significance was expected to come from the 45-day cycle, which is the most dominant cycle that we track for the U.S. stock market - as measured by the SPX. Take a look:
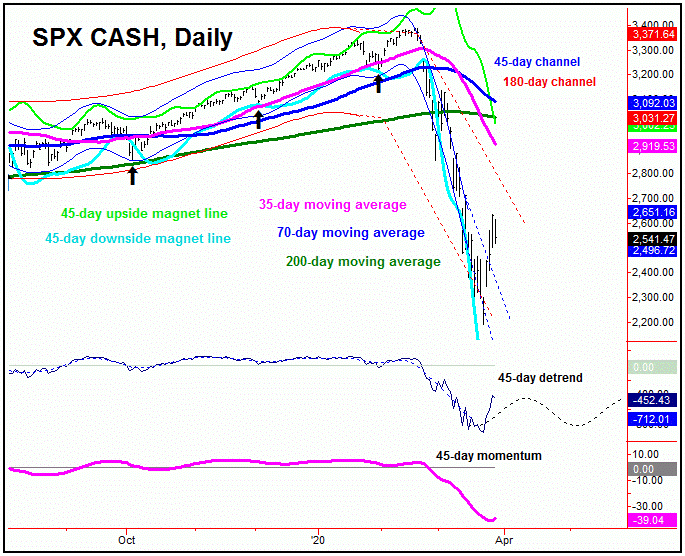
With the action seen in recent days, the probabilities favor this 45-day cycle to have bottomed - even though we have yet to actually confirm it, due to the wide volatility. Having said that, with both our detrend and momentum indicators having recently turned, I give decent odds that is has bottomed - though I am not ruling out another quick selloff in the coming days, playing out in-between.
Overall, if the 45-day wave has troughed, then the probabilities should favor additional strength in the days/weeks ahead, ideally into the month of April - where we would be looking for a countertrend high to form. This is due again to the larger 180 and 360-day cycles that we track, the combination of which are pointing lower into at the May - June timeframe of this year. We'll take a again look at these larger waves in my next article, posted next weekend. Stay tuned.
Jim Curry
The Gold Wave Trader
http://goldwavetrader.com/
http://cyclewave.homestead.com/


