Gold Cycle And (Quick) Stock Market Update


Gold continued to break to lower price levels in last weeks trading, with the metal hitting its high in Monday's session with the tag of the 1269.40 figure. From there, a decline was seen into Thursday's session, here hitting a low of 1247.00 - before bouncing slightly to end the week.
Short-Term Outlook
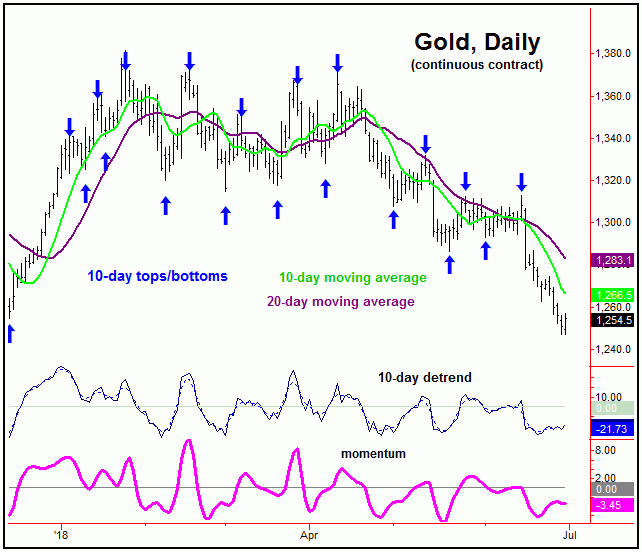
For the very short-term, the downward phasing of the 10-day cycle (chart, above) is still seen as being in force, with this wave now at some 20 days along - and thus is well into extended area for a bottom. The next low for this wave should also trough the larger 20-day component, with any reversal back above the 1262.00 figure (August, 2018 contract) being our best indication that the next upward phase of these waves is back in force.
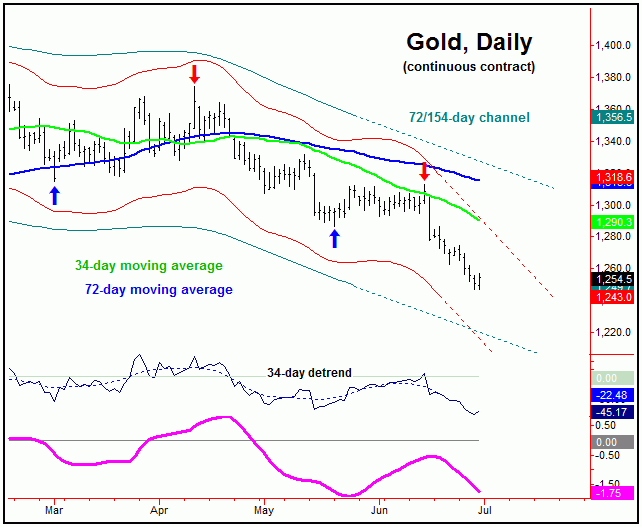
In terms of price, the next rally phase of the 10 and 20-day cycles should see the 20-day moving averages acting as normal price magnet, though with the obvious potential for additional follow- through above the same - such as to the higher 34-day moving average, due to the configuration of the larger 34-day cycle (chart, above).
Stepping back, however, until proven otherwise, the current assumption is that the next short-term rally will end up as a countertrend affair - against the 1313.00 figure (August, 2018 contract). That number is the current upside ‘reversal point’ for the larger 72-day, 20-week, and 154-day cycles, and thus is a key dividing line for the mid-term.
The 72-Day and 20-Week Cycles
Stepping back, as noted in prior articles, the next mid-term trough is expected to come from the 72-day and 20-week cycles. Having said that, the metal was always able to remain below the key upside ‘reversal points' with price - thus never actually triggering this upward phase to be in force. With that, lower lows have continued to play out, thus putting these waves into extended territory for a bottom. Here again is the 72-day cycle:
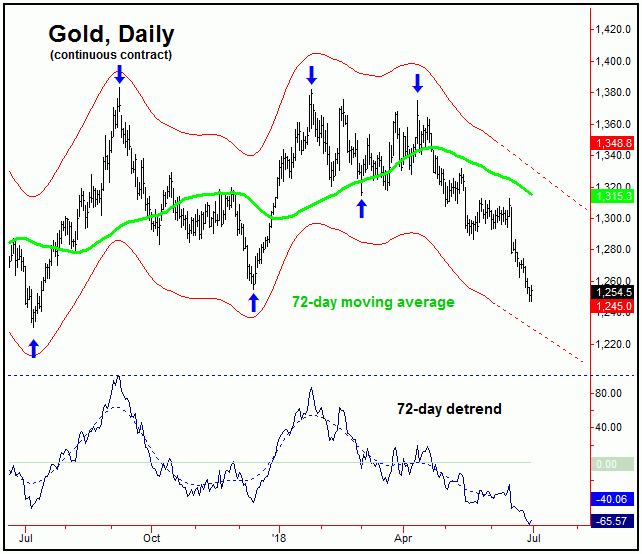
In terms of price, our key upside reversal level for the 72-day and 20-week cycles remains at the 1313.00 figure (August, 2018 contract). In other words, any short-term rally that holds below the same would be favored to drop to lower lows on the next swing down, while any reversal above that figure - if instead seen - would be our best indication that these waves have troughed.
Stepping back then, if and when our 72-day and 20-week cycle bottom is set in place, a rally of 8-16% or more is expected to play out, which is a normal statistical upward phase for the combination of these waves. In terms of time, the normal minimum rally with these waves has lasted at least 24 trading days before completing, while the average rallies have taken 39 trading days before actually completing, thus giving us some idea of what to expect with time - once the next upward phasing of these waves is indicated to be in force.
Gold Timing Index (update)
For the mid-term picture, our best indicator of trend direction for the Gold market is our Gold Timing Index, which is shown again on the chart below:
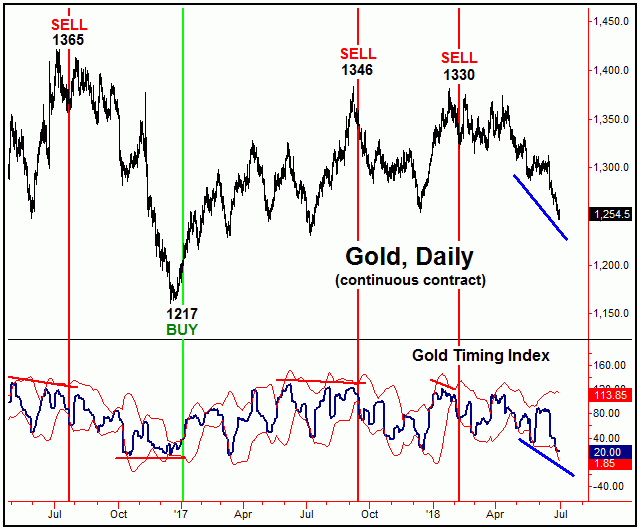
From the comments made in past articles, a divergence between price and our Gold Timing Index is the initial requirement for a mid-term buy signal. For the confirmed signal, however, our indicator then needs to see a close back above its upper standard-deviation band.
The problem with the above is that our most recent divergence with our Gold Timing Index has now been negated with the action seen last week. That divergence would need to re-materialize going forward, in order to trigger our next mid-term buy.
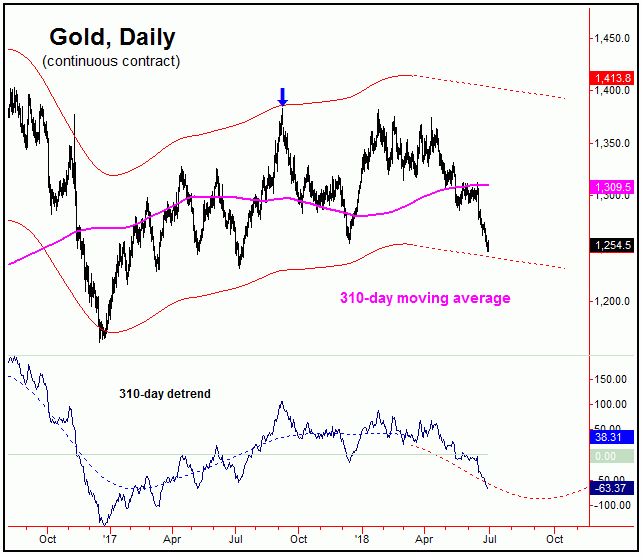
Adding to the notes above, our Gold Timing Index is our most key technical indicator for the medium-term picture, as buy/sells with the same tend to correlate very well with the largest cycle that we track - the 310-day wave (chart, above). Thus, until a new mid-term buy signal is seen with this indicator, we have to view rallies as countertrend.
Gold Commercial Hedgers
In looking at the COT numbers from last week, the commercial hedgers covered another 20,000 of their recent shorts, in the process dropping their current net short total down to 94,963 contracts, with the data current to the 6/25/18 close:
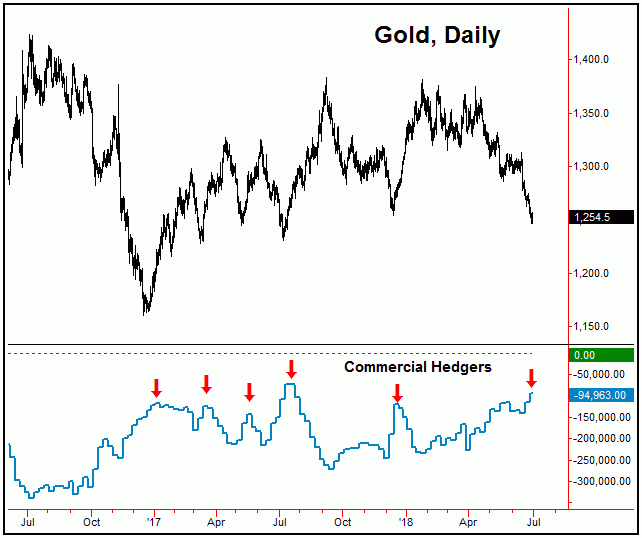
As mentioned in recent articles, the best support for a mid-term rally phase for Gold (with the 72-day and 20-week cycles) is the current position of the commercial hedgers, which are holding near their smallest net short position seen in recent years. Even with that, price has to get above the 1313.00 figure to confirm this upward phase to be in force, otherwise below the same will keep the metal in its bearish configuration.
The Bottom Line For Gold
Summing up the above, both the short-term and mid-term cycles are into extended area for a bottom for the metal, with any reversal above 1262.00 (August, 2018 contract) being the indication that the short-term cycles have turned up - though with a reversal above the 1313.00 figure needed to confirm the same for the mid-term (72-day and 20-week) waves.
The U.S. Stock Market
In taking a quick look at the U.S. stocks, the next mid-term price trough is projected to occur sometime on or after late-September of this year, and should come as a result of the bottoming the 180 and 360-day time cycles, with the larger 360-day wave shown on the chart below:
In terms of price, the minimum expectation for the upcoming 180/360-day low is that the SPX will see a drop back to its 200-day moving average; having said that, a decline back to the lower 360-day moving average would be ideal. In terms of patterns, that move is expected to end up as a countertrend affair - which means that the index should try and remain above the February bottom of 2532.69.
For the bigger picture with stocks, a countertrend low with the 180 and 360-day cycles in the coming months - if seen as expected - should give way to a push back to new all-time highs on the next upward phase of these waves. That upward phase is favored to last until the Spring of 2019, at minimum, and would be the technical setup for a major peak with the larger four and nine-year waves, the combination of which are next due to trough around the year 2020, plus or minus.
Jim Curry
The Gold Wave Trader
http://cyclewave.homestead.com/
Jim Curry is the editor and publisher of The Gold Wave Trader and Market Turns advisories - each of which specializes in the use of cyclic and statistical analysis to time the Gold and U.S. stock markets. He is also the author of several trading-related e-books, and can be reached at the URL's above.


