Gold Cycle And US Stock Market Update


Last week's trading saw gold registering the more bearish pattern of an early-week high into resistance, with the metal hitting a peak of 1788.80 - made on a Tuesday time top. From there, a sharp decline was seen into later in the week, here dropping all the way down to a Friday low of 1691.20 - before bouncing slightly off the same to end the week.
Gold's Cycles, Short-Term View
The short-term picture with the gold market is dominated by the 10-day cycle, which is shown again on the chart below:
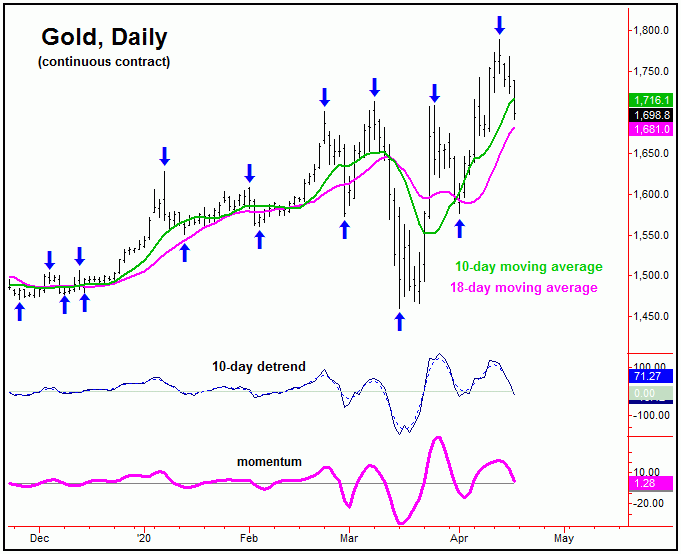
From my article posted last weekend: "the smallest-tracked wave is the 10-day cycle, which is seen as 6 days along - and should give us our next smaller-degree correction phase. Though likely to come from higher numbers first, once the next peak is in place for the 10-day wave, we should be looking for a retrace back to the 10-day moving average as it next troughs. In terms of time, this wave is next due to low-out on or past the mid-April timeframe. As mentioned, the next downward phase of this cycle should end up as a countertrend affair, due to the configuration of the larger 34-day wave."
As pointed out last weekend, the 10-day cycle was soon due to top out - and was looking for its short-term downward phase to materialize. That decline was confirmed to be in force, with the minimum expectation calling for a drop back to the 10-day moving average for gold - which was easily met with the action that followed.
With the above said and noted, this 10-day cycle is back in bottoming territory, and with that should give us our next short-term low. In terms of patterns, the overall assumption is that the decline phase of this wave will end up as a countertrend affair, holding above the prior 10-day trough of 1576.00, with more precise details noted in our thrice-weekly Gold Wave Trader report.
Stepping back, until proven otherwise we have the larger 34 and 72-day cycles still pushing higher in the coming weeks, ideally holding up into the month of May - before giving way to another larger percentage decline phase, which should come as a result of the 72-day cycle - which last bottomed back in mid-March:
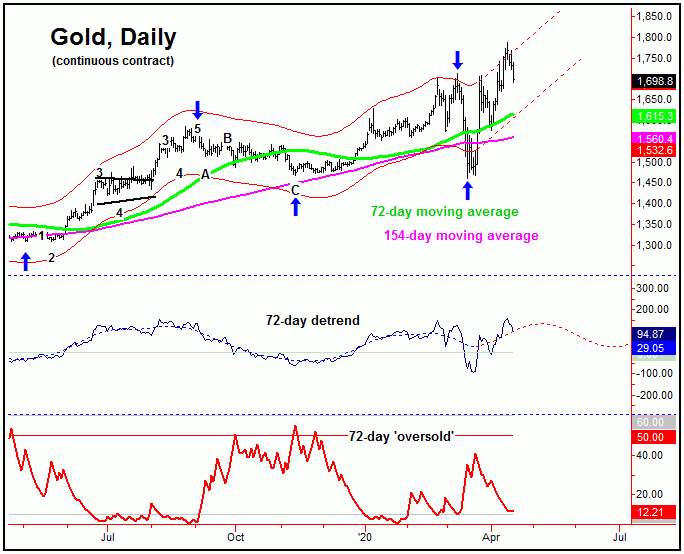
With the chart above, we can see that the 72-day cycle channels are projecting higher in the coming weeks, though we should continue to see the normal up-and-down gyrations in-between. I should add that there is one brewing problem with technicals, which comes from our Mid-Term Breadth index for gold, which is shown below:
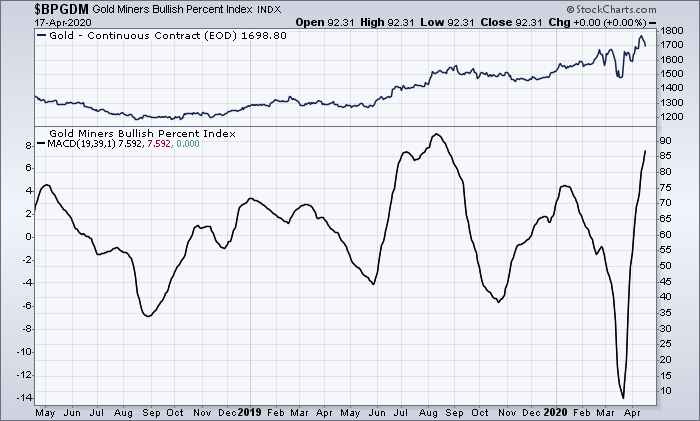
The chart above shows the action of mid-term breadth for gold, with this indicator showing a current reading of 87. Since this indicator has a scale of 0-100, it is moving closer to the range where market tops tend to form, which makes the implication that any new price highs are likely to be fairly limited going forward, at least until the 72-day cycle goes into its next correction phase - to alleviate this condition.
Regardless of the above, the next downward phase of the 72-day cycle is expected to end up as a countertrend affair - holding above the mid-March trough of 1460. Having said that, the 72-day moving average should provided a minimum magnet to that decline. However, if the next trough for this 72-day wave does end up as the anticipated countertrend affair, then the larger uptrend is expected to hold up into later this year, before forming what is expected to be the next major price top.
Going further with the above, with the larger uptrend is favored to remain intact into late-2020, we have to ask "where are the good buying points" - which is an issue that we discuss in our Gold Wave Trader outlook. Identifying these time/price zones is key going forward, since we expect an eventual run to the 2000 figure or better before the next semi-major top attempts to form - which should come from the larger four-year cycle, which is shown again on the next chart:
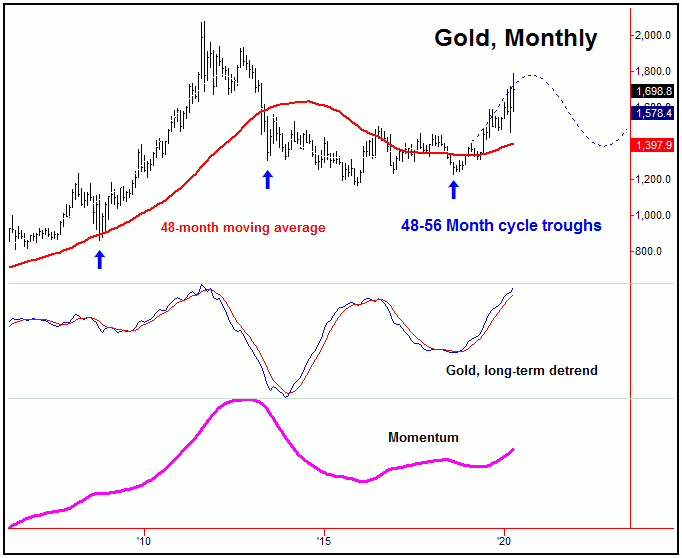
We have looked at this four-year wave in past articles. This is the cycle that is most important to the longer-term trend of the gold market, and has to be monitored very closely going forward. In simply looking at the indicators that track this wave, our detrend is moving towards the upper-end of its range, and any turn south in both this indicator - and the lower momentum indicator - would be a signal that this wave has topped, and that a much larger-degree correction is going to unfold. For now, this is not expected until later this year, though we will continue to monitor.
U.S. Stock Market
As noted in past weeks, the last semi-important low for the U.S. stock market came back on March 23rd, doing so with the tag of the 2190.86 SPX CASH figure. Here again is that 45-day cycle:
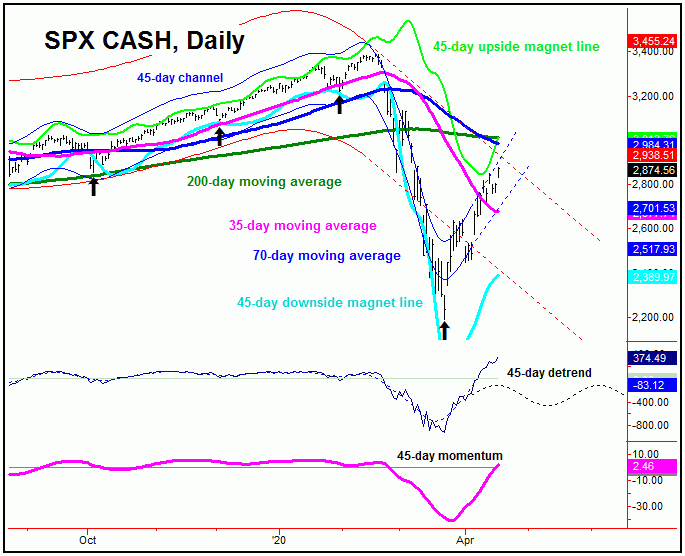
In terms of price with the above, the 35-day moving average was the noted price magnet to the upward phase of this 45-day cycle, which was easily met with the action that followed. Having said that, as pointed out last weekend, the next larger wave - the 90-day cycle - was also able to confirm a turn higher, which puts the 70-day moving average as the next expected magnet in the coming weeks.
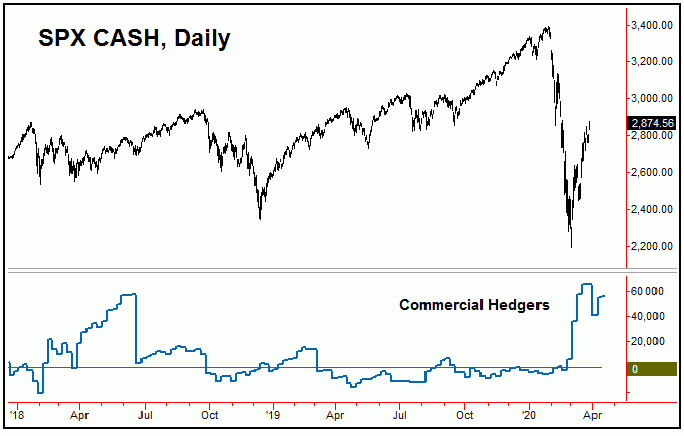
Supporting the idea of additional strength in the coming weeks is the position of the commercial hedgers, which are currently holding some 55,283 contracts to the long side - having moved to their largest net long position in recent years just prior to the March bottom in stocks:
Even with the above said and noted, the overall assumption is that the move will end up as an eventual countertrend affair - holding below the mid-February peak. If correct, then we expect another larger decline on the next downward phase of the 90-day cycle into the Summer months, with more exact details mentioned in our daily/weekly Market Turns report, which covers the U.S. stock market.
The Bottom Line
The bottom line with the above is that gold is in a short-term countertrend correction with the 10-day cycle at the present time, with the next smaller-degree low expected to come from the same. From there, a push back to or above the recent highs, before turning south again into the next 72-day cycle bottom. With U.S. stocks, we have a rally still in force with the 45 and 90-day time cycles, though with the move expected to end up as countertrend - against the downward phasing of the larger-degree waves into the Summer months. Stay tuned.
Jim Curry
The Gold Wave Trader
http://goldwavetrader.com/
http://cyclewave.homestead.com/


