Gold Cycle Forecast & U.S. Stock Market Update


 Last week's trading saw gold forming its low into Monday/Tuesday, here doing so at the 1784.70 figure. From there, strength was seen into later in the week, with the metal running up to a Thursday high of 1819.50 - before consolidating the action into Friday. For the five-day period, the metal managed to end marginally higher overall.
Gold Market Forecast, Short-Term
In looking at the smaller-degree cycles for gold, the most dominant of these is the 34-day wave, which is shown again on the chart below:
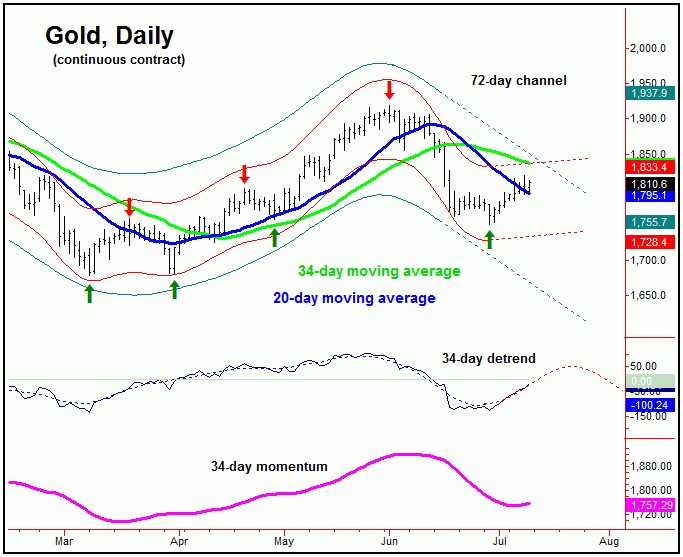
As mentioned in recent articles, the last short-term correction phase into late-June was the odds-on favorite to bottom this 34-day cycle, with the 1750.10 swing low being the potential trough for that move. The price action into early last week finally confirmed this to be the case, and with that this wave is now seen as heading higher in the next week or two, before forming its next peak.
In terms of price, since a cycle will revert back to a moving average of the same length better than 85% of the time, the probabilities will favor a push on up to the 34-day moving average in the days ahead, before topping this 34-day component. This moving average is currently at the 1837 figure (August, 2021 contract) - but which is declining daily.
Going further with the above, the 34-day moving average is at or near the top of the extrapolated (and declining) 72-day cycle channel - thus also making it a key resistance level for the metal. With that, if the rally up off the late-June trough is going to end up as a countertrend affair, then it would likely have to stop at or near this 34-day moving average and/or the upper 72-day channel line.
The chart below shows the approximate positioning of the larger 72-day cycle:
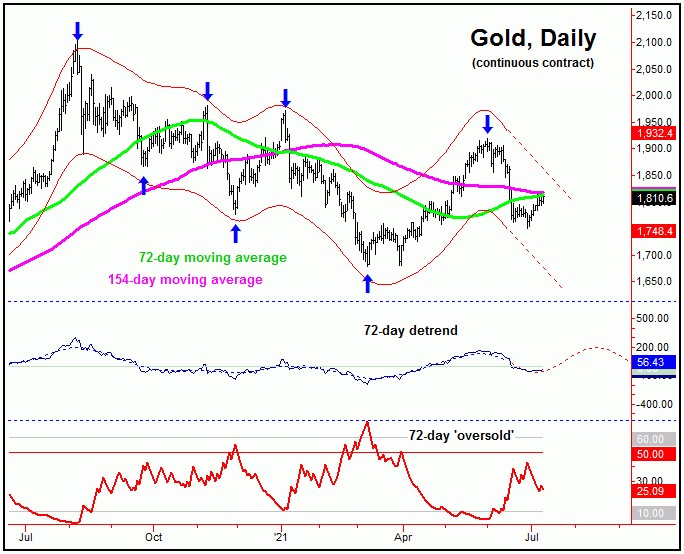
There is the potential that our 72-day wave also bottomed out with the late-June tag of the 1750.10 figure. Having said that, there are technical indications which would argue against that, though more key is the action from price.
With the above said and noted, if gold can overcome our upper 72-day channel (which is more key on a closing basis), then that move would best confirm the next rally phase of this 72-day wave to be back in force.
Going further with the above, an upturn with the 72-day cycle would favor additional strength into mid-to-late August, before working on a more important price peak. That peak is expected to come from the next larger wave, the 154-day component - and shown on the next chart:
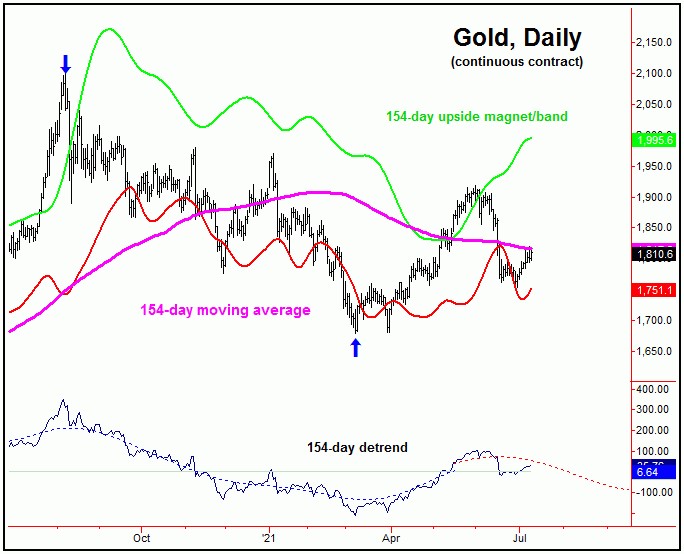
The chart above shows the 154-day cycle for gold. In terms of time, of key note is that this wave is next projected to trough around the month of November, plus or minus. With that, the next upward phase of the smaller 72-day wave should be the one that tops this 154-day wave for its expected correction into that timeframe, bottoming both waves for a sharp push higher into February of 2022.
U.S. Stocks Working on Mid-Term Peak
In taking a quick look at the U.S. stock market - as measured by the S&P 500 index, or 'SPX' - this market is still in the process of forming a mid-term top. That top is expected to come from the combination of the 180 and 360-day cycles, with the larger 360-day wave shown on the next chart:
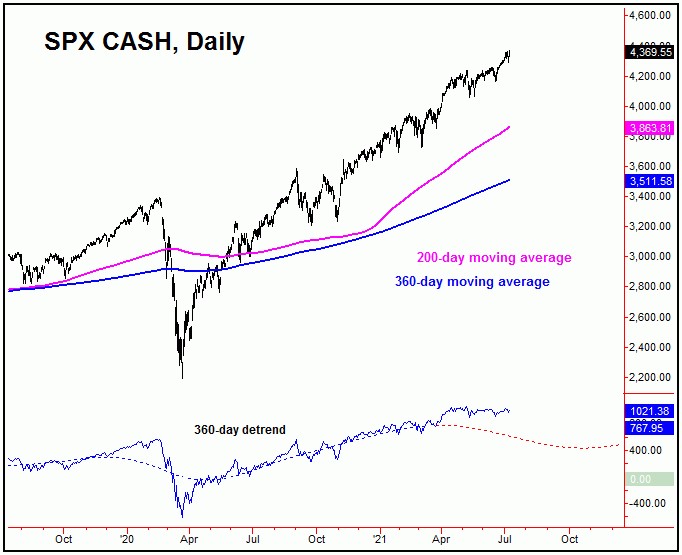
The last decent short-term correction saw the SPX bottoming back on June 18th, doing so with the tag of the 4164.40 figure. We were able to buy into that weakness, having exited that position into the recent strength - and are now looking to buy the next larger-degree decline, which we believe to be in the not-too-distant future.
Going further, the 200-day moving average is likely to act as a magnet to the coming decline. In terms of price, the coming decline in U.S. stocks is expected to the largest percentage correction of this year.
Even with the above said and noted, none of our key downside reversal levels have been violated in past months. With that, we are watching a key number (exact details in our Market Turns report), which - when taken out to the downside - will be our best indication/confirmation that the next larger decline phase is in force for U.S. stocks.
For the bigger picture, however, the probabilities do favor the next mid-term decline phase in the U.S. stock market to end up as a countertrend affair, within an ideal bottoming window of August - October of this year. If correct, what follows should be another rally of 20-40% or more, lasting well into next year - before the next larger-degree peak forms. More on this as we continue to move forward.
Jim Curry
The Gold Wave Trader
http://goldwavetrader.com/
http://cyclewave.homestead.com/
********


