Gold Cycles Pushing Higher Into May


The holiday-shortened week saw gold forming its low for the week in Monday's session, here doing so at the 1638.20 figure (June, 2020 contract). From there, a sharp push higher was seen into late-week, with the metal running all the way up to a Friday peak of 1754.50 - also managing to end the week at or within earshot of the same.
Gold's Cyclical Picture
With the action seen into last week, the first thing is to take a look at the status of the cycles that we track for the gold market. The currently-viewed positioning of these cycles is shown in the table below:
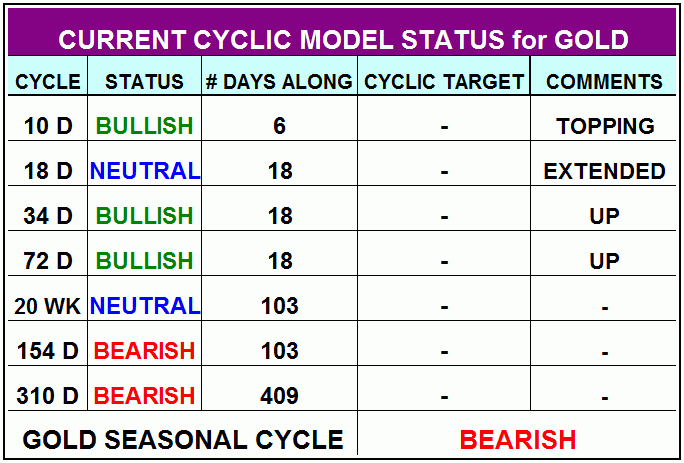
For the very short-term, the smallest-tracked wave is the 10-day cycle, which is seen as 6 trading days along - and thus should give us our next smaller-degree correction phase. With the larger 34 and 72-day cycles seen as pointing higher into the month of May, we expect the next 10-day cycle bottom to end up as a countertrend affair, holding well above its prior trough of 1576.00 - seen back on April 1st.
We can see each of the prior 10-day tops and bottoms on the next chart:
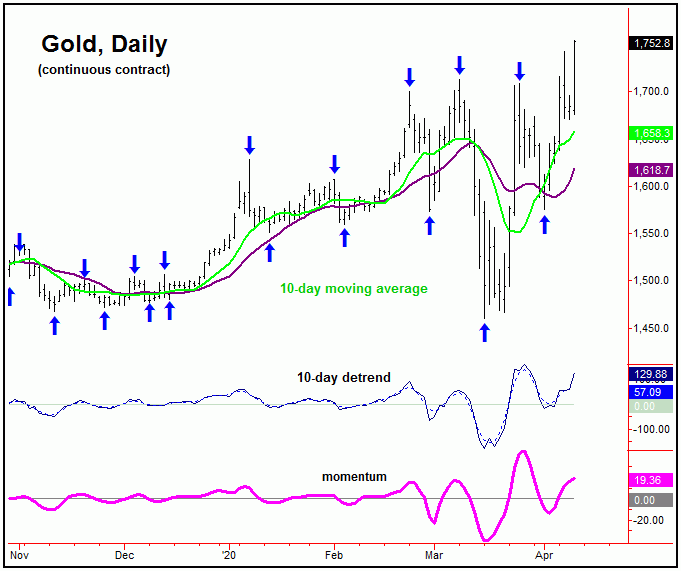
Though likely to come from higher numbers first, once the next peak is in place for the 10-day wave, we should be looking for a retrace back to the 10-day moving average as it next troughs. In terms of time, this wave is next due to low-out on or past the mid-April timeframe. As mentioned, the next downward phase of this cycle should end up as a countertrend affair, due to the configuration of the larger 34-day wave, which is dominating the action - and is shown on the chart below:

The chart above shows the 34-day wave, which is 18 trading days along from its late-March bottom - with the Elliott wave pattern labeling the early-April trough as a wave '2', and a developing wave '3' to the upside as currently in force. As noted earlier, this favors the next downward phase of the smaller 10-day wave to end up as countertrend, to be followed by higher highs on the next swing up - which would be the odds-on favorite to top this 34-day cycle for a wave '4' decline into early-May.
Going further with the above, due to the configuration of the next larger wave - the 72-day cycle - a wave 4 decline with the 34-day component into early-May - if seen as expected - should give way to higher highs on the next swing up, eventually completing wave 5 of the move, and topping this 72-day component.
Here again is our 72-day wave:
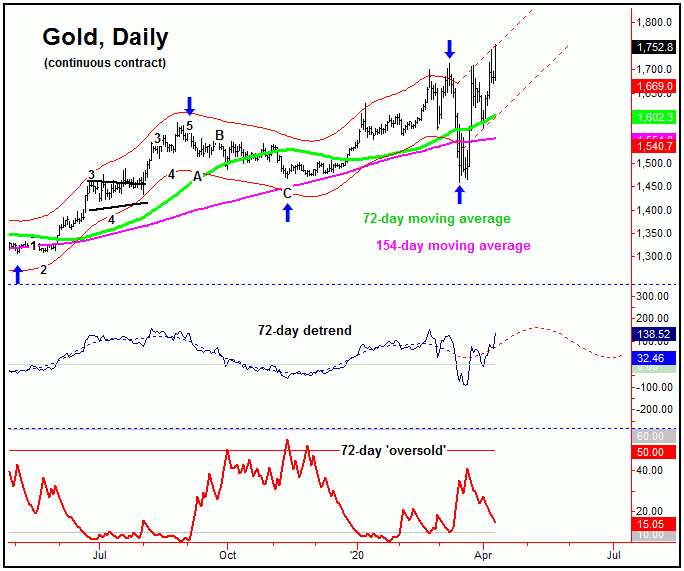
The last peak for our 72-day cycle was made in early-March (i.e., the 'kill zone', as noted in prior articles), and saw a contracted trough at the March 16 bottom of 1460 (June, 2020 contract). In terms of time, there would be some focus on the mid-to-late May timeframe to end up as the next peak for this wave (i.e., wave 5). Once complete, however, another larger percentage decline should be expected to play out, one which sees the 72-day moving average acting as the eventual magnet.
In terms of patterns, the next downward phase of the 72-day cycle is also expected to end up as a countertrend affair, and with that should remain above the mid-March bottom. In terms of time, the next trough for this 72-day cycle is projected for the mid-to-late June timeframe. Once complete, a resumption of the uptrend should play out, with that larger uptrend expected to last until later this year - where we will be looking for the next major top to form, coming from the larger four-year wave.
In terms of technical action, our Mid-Term Breadth index for gold is still pointing higher at the present time:
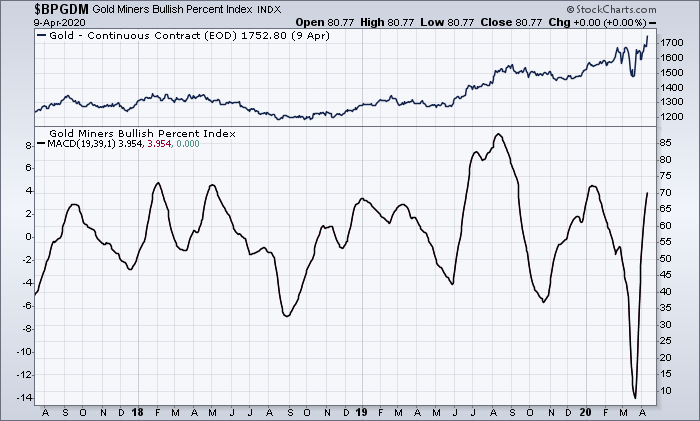
With the cycles - and breadth - heading higher at the present time, we will continue with the idea of buying short-term cycle bottoms, within the larger uptrend into May, before being on the lookout for the next decent correction phase to unfold.
U.S. Stock Market
From the comments made in past articles, the 45-day cycle in U.S. stocks (as measured by the S&P 500 index, or 'SPX') last bottomed back on March 23rd, doing so with the tag of the 2190.86 SPX CASH figure. Here again is that 45-day component:
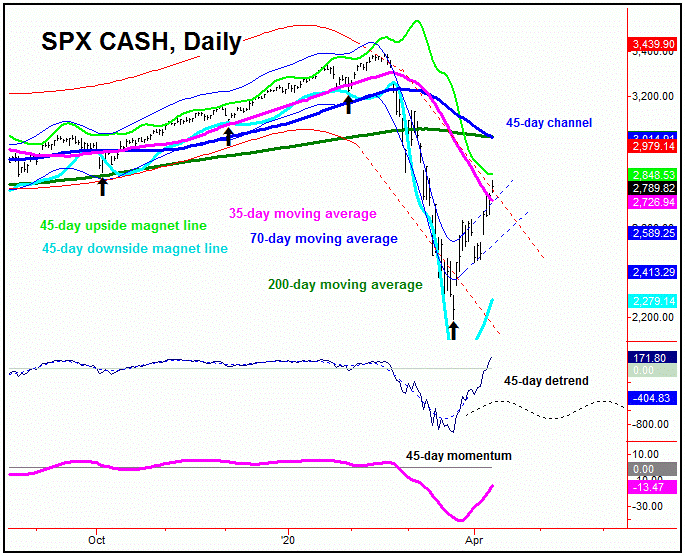
In terms of price, I mentioned the 35-day moving average acting as the expected price magnet for the upward phase of this wave - which was finally met with the action seen into last week, thus meeting any normal minimum assumption in regards to this wave.
Having said the above, the overall action with stocks also suggests that a bottom with the larger 90-day cycle was registered back in March, with that cycle shown on our next chart:
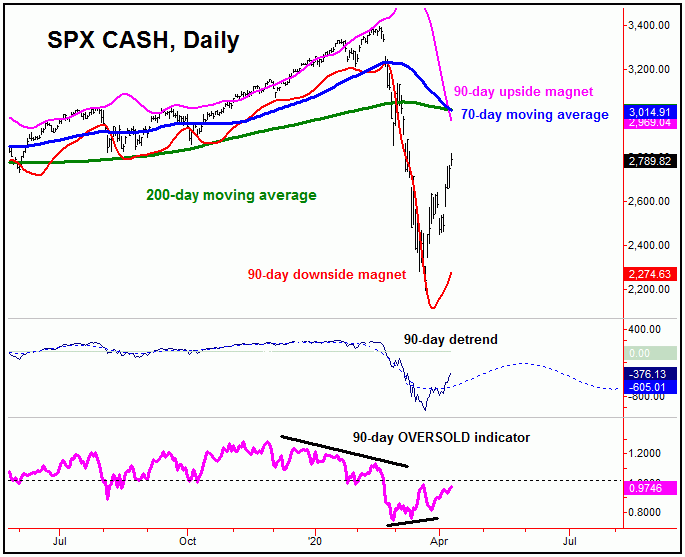
In our daily and weekly Market Turns reports (which cover the U.S. stock market), we pointed out a decent divergence forming in our 90-day 'oversold' indicator - with a similar divergence registered prior to the February top.
With the above said and noted, following my rule that a cycle will revert back to a moving average of the same length better than 85% of the time, the 70-day moving average is the next logical price magnet, which is well above current price levels. Interestingly, the 70 and 200-day moving averages are conjuncting together at the low-end 3000's on the SPX, though with the smaller 70-day average declining at a faster rate.
For the bigger picture, as mentioned last weekend the mid-term cycles for stocks are pushing lower into around mid-Summer. With that, until proven otherwise, we are looking for the current upward phasing of the smaller 45 and 90-day cycles to end up as an eventual countertrend affair - though obviously from higher numbers than already seen. Supporting that idea is the current position of the commercial hedgers, which are currently holding around 54,000 contracts to the long side.
The Bottom Line
The overall bottom line with the above is that gold's uptrend is expected to remain intact into the month of May, though with a short-term (countertrend) correction phase likely just around the corner, with our 10-day wave. As for U.S. stocks, higher prices are also expected to continue for at least the coming weeks, before setting up the next peak of importance - one which should be followed by a sharp decline back to or below the March lows on the next swing down with the 45 and 90-day cycles.
Jim Curry
The Gold Wave Trader
http://goldwavetrader.com/
http://cyclewave.homestead.com/


