Gold Cycles In A Series Of Corrections


Last week's trading saw gold holding weaker into Wednesday's session, where the low for the week was eventually made with the tag of the 1683.00 figure. From there, strength was seen into an early-Friday high of 1735.50 - before backing off the same into the daily/weekly close.
Gold's Technical View
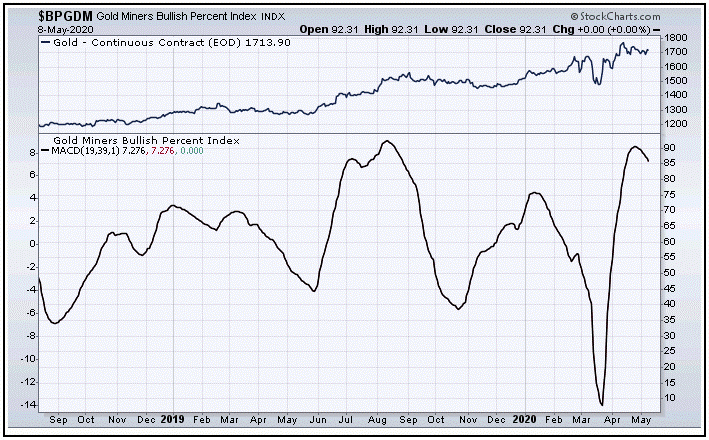
The one technical problem for gold in the coming weeks is the configuration of our Mid-Term Breadth index for gold, which is shown again on the chart above. This indicator recently turned lower from the upper end of its range, and with that favors any short-term upside to be limited to the recent highs, or else a marginal new high.
At the next trough with the 72-day cycle, we should expect to see this indicator coming back down to the middle to lower end of its range (to work off the overbought condition). Additionally, the ideal path would be for our 72-day 'oversold' indicator to spike back above its upper reference line, something seen at or near bottoms with this cyclic component. Here again is our 72-day component:
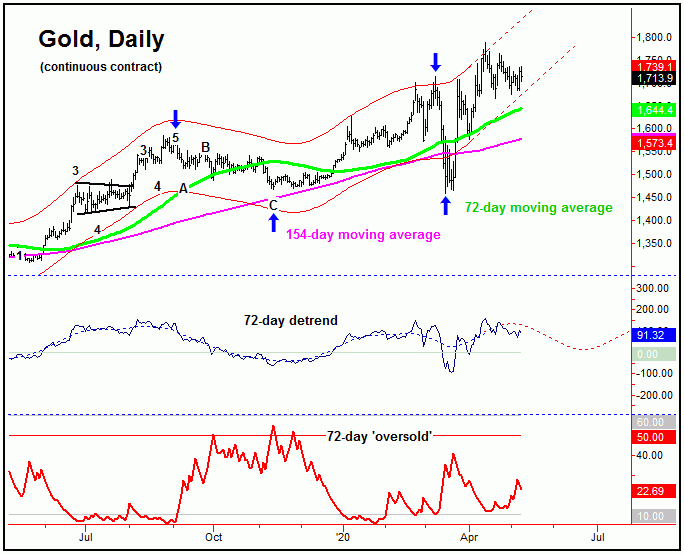
With the above said and noted, there are a couple of observations that can be made with the 72-day cycle. We can see from the chart above that the channels that track this wave are currently pointing up- which means that the overall trend with this wave is higher at the present time.
However, the 72-day wave is also looking for a decent decline correction into June. With that, if our 72-day 'oversold' indicator is able to spike back above its upper reference line going forward, then we will have the ideal technical setup for a longer-term buy signal. This buy signal is key going forward - as it could be the last one seen prior to a major rally into later this year (see my April 8th article: 'Gold's Next Move Up Will Be Spectacular').
The Long-Term View
For the longer-term picture, one of the largest cycles that we track is the 310-day wave, which bottomed with the tag of the 310-day moving average back in mid-March. Here again is that cycle, shown below:
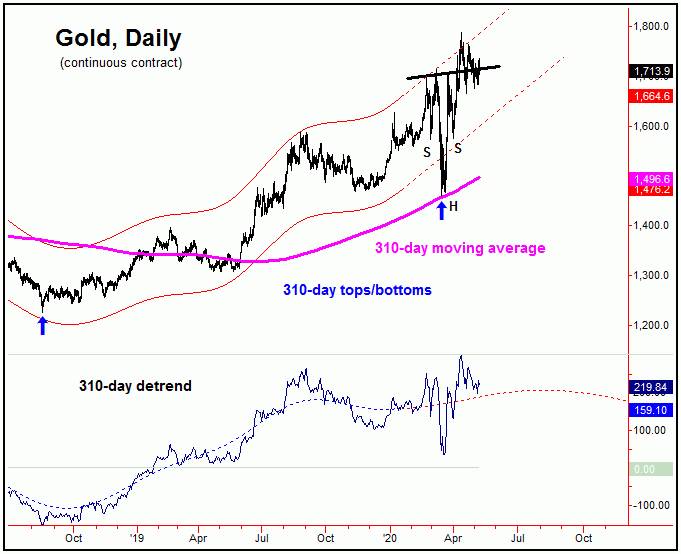
In terms of time, as mentioned in some articles posted earlier this year, the low for this 310-day component was originally projected for the month of April. Having said that, due to the size of this wave, there is a larger plus or minus of a month or so in either direction - and thus a mid-March tag of the 310-day moving average was made into the early-end of this range.
Even said, if the 310-day cycle did bottom back in March, then the probabilities should favor this wave to push higher into later this year. That move - if seen as favored - would be the odds-on favorite to top the larger four-year cycle, for what is expected to be a larger-degree decline into next year. In terms of price, as noted in past reports, the 48-month moving average should act as the magnet to the next downward phase of that four-year wave, shown again below:
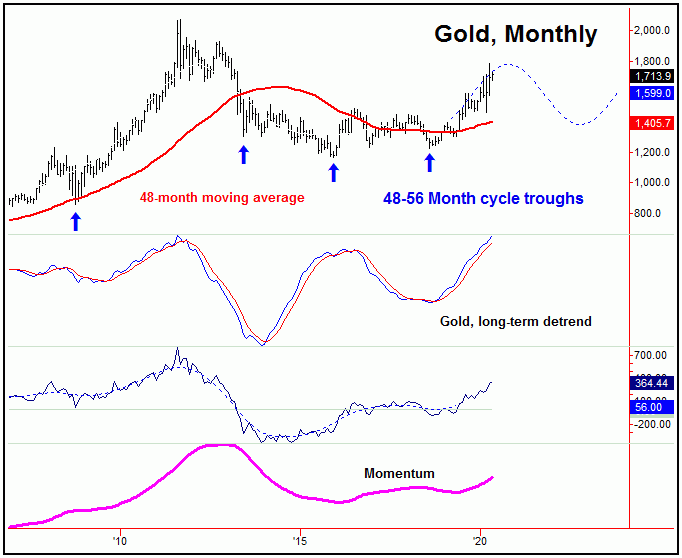
Most of the trend and momentum indications that track the four-year cycle are still pointing higher, ideally into later this year. In terms of price, that peak should come north of the 2000 figure, something which is also suggested by the inverse 'head & shoulder' pattern that has formed on the daily/weekly chart.
With the above said and noted, following the completion of a 72-day cycle trough in the next month, we will have each of the 72-day, 154-day (not shown), 310-day and four-year cycles pointing higher into later this year - thus supporting the idea that a spectacular rally is coming, with more precise details noted in our thrice-weekly Gold Wave Trader market report.
U.S. Stock Market
As mentioned in prior articles, the 45-day cycle has been responsible for the rally seen off the late-March low in stocks, and with that is now seen as 33 days along and is moving into extended range for a peak. Here again is that cycle:
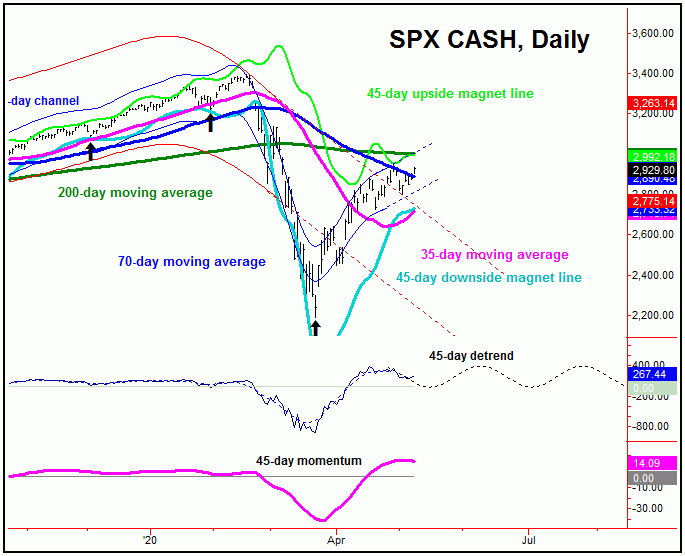
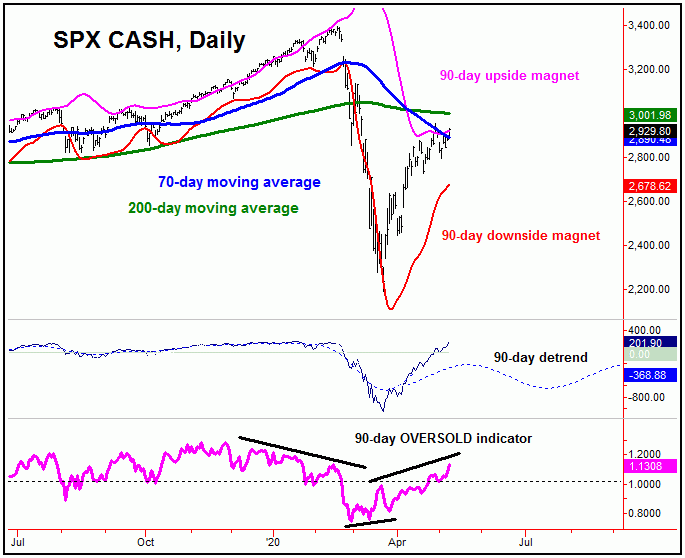
In terms of price, the minimum expectation with the upward phase of this 45-day wave called for a rally back to the 35-day moving average, though later upgraded to a tag of the 70-day average - due to confirmed turn with the larger 90-day cycle. This larger 90-day wave is also seen as 33 days along, and is still regarded as bullish into what looks to the mid-June timeframe:
With the smaller 45-day wave now at some 33 trading days along, as noted above it is at or into extended range for a peak. Once this wave does top, a drop back to the 35-day moving average would again be the expectation, in what is favored to be a countertrend affair. In terms of price, our downside ‘reversal point’ for this 45-day wave has now moved up to the 2796.00 SPX CASH figure intraday - and should continue to rise going forward, depending on the action.
With the above said and noted, any reversal below the 2796.00 SPX CASH figure - if seen at any point going forward - would confirm the next downward phase of the 45-day wave to be back in force. In turn, that would trigger a near-automatic drop on back to the 35-day moving average or lower. As mentioned above, that decline is expected to end up as countertrend - against the March bottom of 2190.86 SPX CASH.
As for the larger 90-day wave, as mentioned this component is seen as heading higher into the mid-June timeframe, plus or minus. With that, the overall assumption is that the next correction phase of the 45-day wave - if it plays out prior to June - will end up as a countertrend affair, and, if correct, will give way to higher highs on the next swing up into June.
Stepping back further, if the SPX is making higher highs into mid-June or later, then the probabilities will favor both another 45-day and a 90-day cycle (combination) peak forming. From there, the overall assumption is that a larger-percentage decline will play out into what is projected to be the mid-to-late July region. Thus, if the SPX has a lower low still out there for the larger swing - or else a hard re-test low - this mid-to-late July timeframe looks to be the prime spot.
The Bottom Line
The overall bottom line for gold is that we have several corrections to complete in the next month or so, which could be a frustrating time for many traders. The eventual resolution, however, should be to the upside, once the next 72-day trough is set in place. As for U.S. stocks, the ideal path has the SPX headed higher into mid-June, though with an intervening correction with the 45-day cycle. If the SPX is making higher highs into mid-June or later, it will be time to be on the lookout for technical indications of the next semi-important peak forming - none of which have yet to actually develop. Stay tuned.
Jim Curry
The Gold Wave Trader
http://goldwavetrader.com/
http://cyclewave.homestead.com/


