Gold Cycles Short-Term Toppy, Mid-Term Higher


Last week's trading saw gold forming its low in Tuesday's session - here doing so with the tag of the 1666.20 figure for the June contract. From there, a sharp rally was seen into late-week, with the metal running all the way up to a Thursday peak of 1764.20 - before backing slightly off the same into Friday.
Gold's Cycles, Short-Term
From the comments made in my article posted last weekend, the downward phase of the 10-day cycle was seen as in force, with the next short-term bottom expected to come from this same cycle:
From last weekend: "this 10-day cycle is back in bottoming territory, and with that should give us our next short-term low. In terms of patterns, the overall assumption is that the decline phase of this wave will end up as a countertrend affair, holding above the prior 10-day trough of 1576.00."
Here again is our 10-day component:
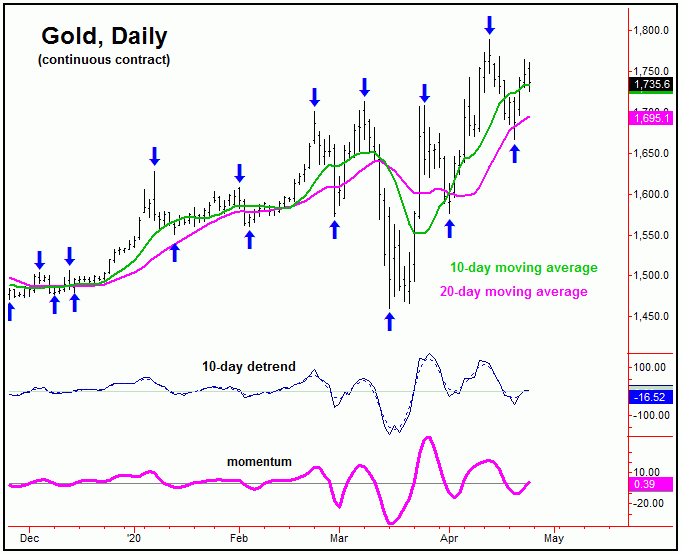
In terms of price, in our market report, I also noted the presence of a larger (but less dominant) 20-day cycle, which gave the decent potential for a drop back to the lower 20-day moving average before the smaller 10-day cycle would bottom - which we obviously saw with the decline into last Tuesday.
In terms of patterns, however, the decline into the last 10-day cycle trough was favored to end up as a countertrend affair - holding above the prior 10-day trough of 1576.00, made into early-April. We got that, and the subsequent action confirmed the low for this wave to be in place - with the following rally looking for a minimum expected tag of the 10-day moving average or higher, which we easily saw.
With the above said and noted, our next short-term peak should come from this same 10-day wave, which I am favoring to end up as countertrend - against the 1788.80 swing top. In other words, we should be at or nearing another decent swing top with the smaller-degree waves, with more exact details noted in our thrice-weekly Gold Wave Trader report.
Gold's Medium-Term View
Though the short-term picture is positioning for another correction, the mid-term picture is still leaning bullish, due to our 72-day cycle, which is shown again on the chart below:
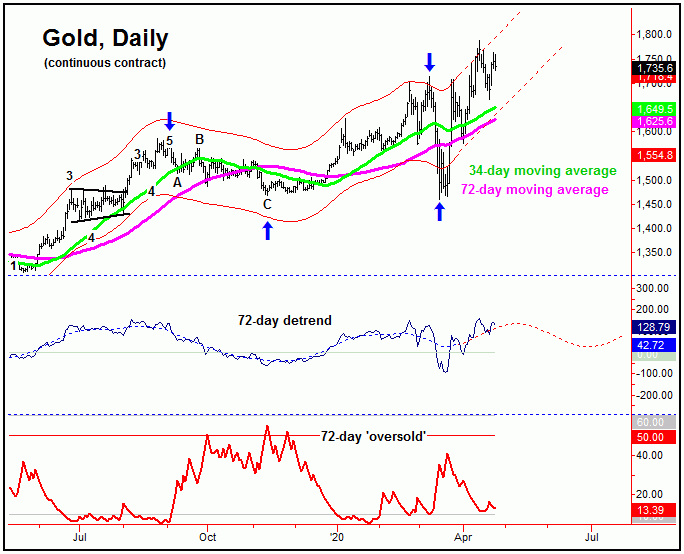
The last trough for this 72-day wave came slightly on the early side, bottoming back in mid-March with the tag of the 1460.00 figure (June, 2020 contract). This wave is currently pointing higher here, and is projected to remain pointing up into the month of May, before readying the gold market for another larger percentage decline.
On this 72-day chart, there are a couple of observations to be made. The first is the positioning of the 34 and 72-day moving averages, with the more key of focus being the smaller 34-day moving average. We are expecting a drop back to this moving average in the near-term - perhaps sooner than most people expect - even though the decline would be expected to end up as a countertrend affair.
The second observation to be made from this chart is the configuration of our 72-day 'oversold' indicator (in red, bottom pane). This indicator moves inverse to the action of price, and is at or near bottoming levels. This means that the rally phase of this cycle is probably limited for the time being, even with higher price highs expected to play out before this wave tops.
Adding to the notes above, for a real good-looking 72-day trough, we like to see this indicator moving above its upper reference line - something which never materialized at the mid-March bottom. Since it was not seen there, the probabilities increase that it will be seen on the next go-round of this wave, and thus will be on the lookout for it into the month of June, thus setting up the next good buy for the Gold market.
Going further with the above, I mentioned last weekend a brewing technical problem for gold, which was the position of our Mid-Term Breadth index, shown again below:
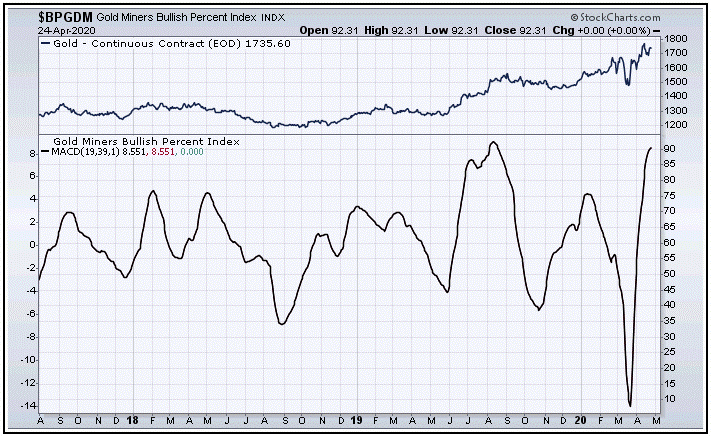
This indicator has an overall range of 0 to 100, and - with a current reading of 91 - it suggests that the remaining rally phase of the 72-day cycle should be fairly limited. In other words, the metal will need to work off the overbought state going forward, which should set the metal up for its next larger advance phase, once again with more exact details noted in our Gold Wave Trader report.
U.S. Stocks Update
As noted in past weeks, the last good rally phase was in force, coming from our most dominant cycle for U.S. stocks - the 45-day component:
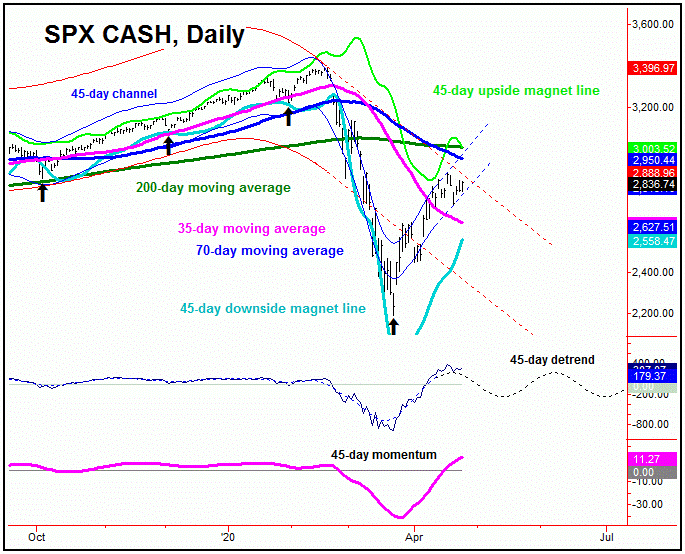
From last weekend: "the 35-day moving average was the noted price magnet to the upward phase of this 45-day cycle, which was easily met with the action that followed. Having said that, as pointed out last weekend, the next larger wave - the 90-day cycle - was also able to confirm a turn higher, which puts the 70-day moving average as the next expected magnet in the coming weeks."
From the comments made in past articles, the 35-day moving average was the 'magnet' to the upward phase of our 45-day cycle, though with the following analysis suggesting an upturn in our larger 90-day wave - which puts the 70-day moving average as the next expected magnet. Take a look at our next chart:
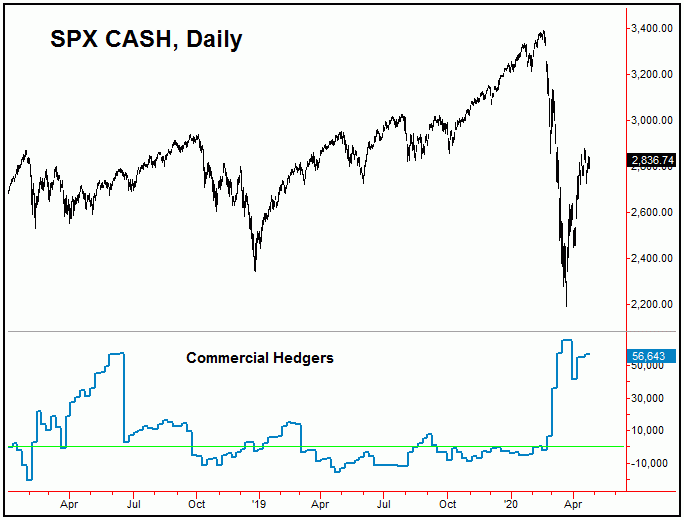
The chart above shows the current position of the commercial hedgers for the SPX, which has them holding some 56,643 contracts to the long side - having added approximately 1,300 contracts over the prior week. With the hedgers moving to a multi-year long position back in late-March, this was huge fuel for the recent rally phase of the 45-day cycle.
Having said the above, the SPX should still see its normal correction phase with the 45-day wave, with that cycle starting to move back into topping range. However, due to the configuration of the commercial hedgers - and due to other technical factors - we do expect the next downward phase of this wave to end up as countertrend, holding well above that late-March price trough. From there, we will see another rally into June, then to take a closer look at the accompanying action from technicals - with the larger trend still pointing down.
The Bottom Line
The overall bottom line is that gold should be in a series of correction phases in the coming weeks, though with the larger uptrend projected to remain intact well into late-year. As for the U.S. stock market, we are in what is expected to be a countertrend rally with the 45 and 90-day cycles, though with the smaller (45-day) wave coming due for a peak - and a countertrend correction phase. Stay tuned.
Jim Curry
The Gold Wave Trader
http://goldwavetrader.com/
http://cyclewave.homestead.com/


