Gold Daily/Weekly Cycle Bottom Coming Due


For the near-term action in the gold market, there are several key cycles that are coming due right now with the gold market, with both the daily weekly cycles due for a bottom of some degree. Whether that low will end up as anything meaningful remains to be seen, though at least a short-term bottom is expected to materialize, with the daily cycles looking for the same on or around the December 6th date. Take a look at the chart below:

The chart above shows the daily cycle turning point forecast (in aqua), which is a combination of the dominant cycles on the daily chart of the price of gold. The next ‘turn’ from this model is shown for the December 6-9 timeframe – which we are now obviously into. Having said that, daily low turns themselves are not that meaningful - if the larger trend is pointing to the downside!
However, in addition to a daily cycle bottom that is due anywhere in here (again, there is a plus or minus involved), the weekly chart of gold is shows a bottom for the week of December 6th, which is plus or minus a week in either direction. That chart is shown below:

As shown above, the weekly (dominant) cycle is also coming due for a low anywhere in the current timeframe. On the bearish side to this, momentum is pointing to the downside for the weekly chart, though the same is starting to turn up on the daily. To me, the inference is a short-term rally, but one that is followed by lower lows on the next daily/weekly cycle downward phase.
Overall, the dominant cycles on the daily chart are in the 8-12 (trading) day range, 30-34 days, 70-78 days. The low that is due in the current timeframe (from the combination forecast models note above)should come as the result of the 30-34 day wave, which last bottomed back on 10/15/13 – and thus is 35-36 trading days along from the same (chart, below).

With the above said and noted, I take a detailed look at how each of the up and downward phases have played out in the past history of the cycles that I track, in order to get some idea of what to expect in the near-future. With that, in taking a look at a normal statistical upward phase for this 30-34 day component, the average rally has been around 10% from trough-to-peak. However, due to the larger bearish trend, I am more interested in what the greater-majority have done. With that, a good chunk of these have seen rallies of at least 4.4% before topping, which gives us at least an initial indication of how the coming rally with this component will end up playing out.
So far, the lowest low for the current downward phase has been registered on 12/6/13, around the 1210 level for gold. Whether or not this figure will mark the bottom for this cycle is too early to say, though – should that end up as the case – a normal upward phase would be looking for a push up to the 1264-1332 area in the coming days/weeks.
In terms of time with the above, normal rallies with this 30-34 day wave have been around the 11-18 trading day mark, and thus a low anywhere in the current timeframe would suggest the next upward phase could push into the latter part of December.
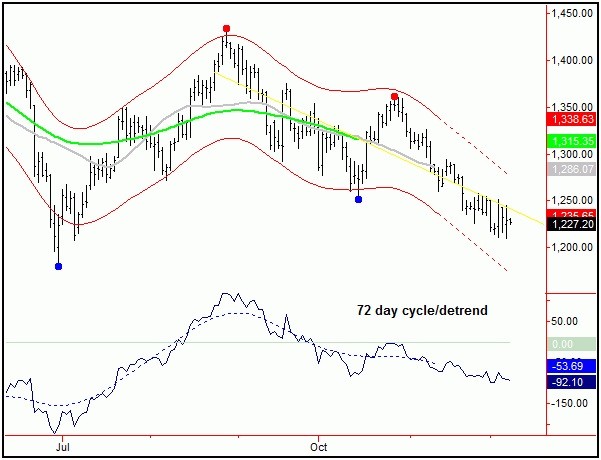
As for the other cycles, the larger 70-78 day wave (chart, above) is still pointing south at the present time – where it also last bottomed back on 10/15/13. In other words, even though a firm trading rally is due, the overall trend is still deemed to be point lower, at least until proven otherwise.
Going further, there is an even-larger 154 day cycle (chart, below) that is dominating the action. This cycle last bottomed all the way back on 6/28/13 at the 1179.90 figure, and then topped again on 8/28/13 at a high of 1434.10. With that, this cycle is currently around 111 trading days along from that trough – and thus is also deemed to be pointing south at the present time, likely into January or February of next year.
If we take a stepped-back view, even a casual Elliottician will note that we are working on a five-wave pattern to the downside from the 1950 high (September, 2011) – with a 5th wave looking to be in progress at the present time. Take a look at the chart below for reference, where you can also see the 154 day cycle:

Interestingly, the rally off the 6/28/13 bottom to the 8/28/13 high retraced precisely 38% of the prior swing down (from the 10/5/12 high) – in other words, a near perfect Elliott wave 4. All said then, for the bigger picture we look to be in the process of completing a 5th wave to the downside, which ideally will bottom out with the next 72/154 day combination low. Once that decline is complete, we should see a hard retracement of the entire bear wave down from the 1950 peak to whatever low that ends up being registered for the move.
Summing it up, we are due for at least a short-term bottom with the 30-34 day wave; a low made here – if that plays out - would be favored to give way to strength and overall higher prices into around late-December, plus or minus. However, due to the position of the larger 72 and 154 day waves, the current assumption is that the upward phase of the 30-34 day wave will end up as a countertrend affair – meaning that it should hold at or well below the prior swing top of 1361.90 (from 10/28/13). If correct, the following 30-34 day downward phase (into January/February) should see new lows for the larger swing, then to set up a bottom with the larger 72 and 154 day cycle – with that bottom completing a perfect Elliott wave 5 pattern to the downside.
The Gold Wave Trader


