Gold Does The Bop 'n Drop
 share
share
 share
share
 share
share
 share
share
 share
share
Barring your having been cave-bound in recent weeks, you well know our guardedness about Gold's recent geo-politically-driven rise as to its being suspect to demise given such historical wont.
However: the timing of RUS' waging war on UKR being coincident with increasingly-visible inflation -- indeed stagflation -- has served to ramp up Gold "awareness": a wokey word to be sure, but worth its weight in this case.
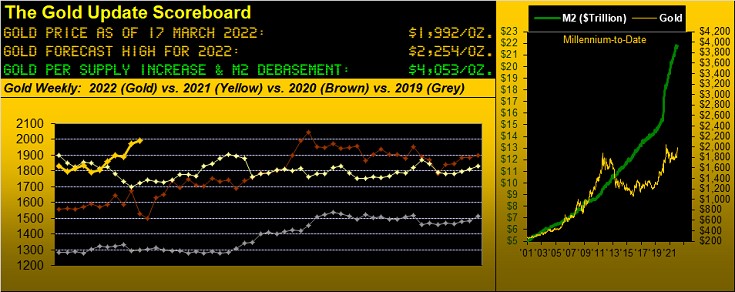
And specific to our missive's title, Gold bopped up this past week to as high as 2079 -- just 10 points from its All-Time High of 2089 (07 August 2020) -- and then summarily dropped to 1961 toward settling out the week yesterday (Friday) at 1992.
The plunge from high-to-low of -117 points was Gold's worst intra-week throttling (by points) since that ending 18 June of last year; by percentage (-5.7%), 'twas in the 14th percentile of Gold's worst high-to-low weeks this century; (and for those of you scoring at home wherein you trade Gold by points rather than percentage, the post-bop drop was the tenth worst points loss since that ending 21 June 2013 during a stint of the Gold Era we'd rather forget).
Still by comparative geo-political price fade, this time 'round Gold "thus far" is much firmer (thank you stagflation) than during RUS' seizing of UKR's Crimean Peninsula back in 2014; again we update these two percentage Gold price tracks:

But even though we opine "firmer" so must we acknowledge "fragile". For the instant 'tis perceived there is a glimmer of hope for some RUS/UKR resolvement, the price of Gold drops like a stone: this past Wednesday alone, aware of diplomacy in the air, Gold intra-day fell better than 2% twice within two mutually-exclusive three-hour periods. Thus our Gold -- even as stagflation-boosted -- is firmly fragile, or fragically firm, depending on your choice of term.
Further we wonder: what would be the price of Gold today had the RUS/UKR incursion not occurred? Recall that through the entirety of 2021, Gold traded just either side of 1780 forever. But to date in 2022, price has been up as much as +13.6% and is at present +12.4%; moreover, Silver's maximum rise thus far is +17.7% and 'tis at present +15.1%. So no complaints there, even as both precious metals are trading at essentially one-half their currency debasement valuations. But should "awareness" further build, our 2022 forecast high of 2254 still can be filled.
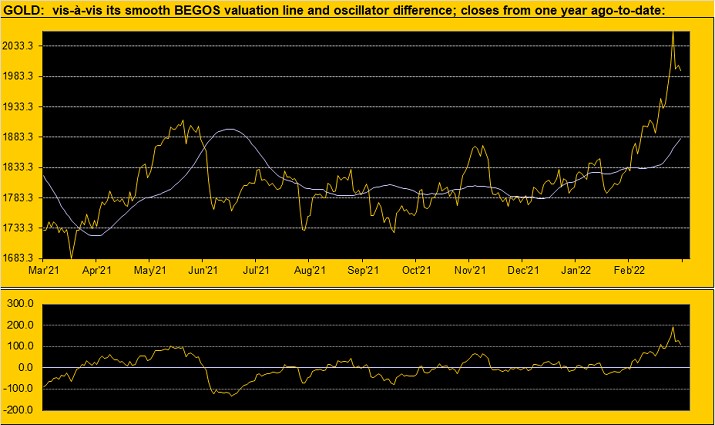
Yet Gold's "bop 'n drop" stands stark per the rightmost weekly bar as we next show here from one year ago-to-date. The price for the ensuing week to flip the present blue-dotted parabolic Long trend to Short is -129 points below 1992 at 1863: given Gold's "expected weekly trading range" is now 63 points, reaching down so extremely (in that vacuum) is at least two weeks away, but...
Indeed speaking of "extreme" -- and as fundamentally undervalued as remains Gold -- one cannot ignore the heights to which price has climbed vis-à-vis its smooth valuation line (borne of how price is changing relative to changes by the other four primary markets which comprise BEGOS, i.e. the Bond, Euro, Gold, Oil and S&P 500). The following graphic per the website depicts from one year ago-to-date the closing price of Gold relative to its smooth line, from which too much deviation results in returning thereto; the difference between the two lines, which emphasizes such extreme, is the oscillator in the lower panel, presently suggesting that at 1992, Gold right now is still 100 points "high". Again this is a purely flexing read specific to how Gold is being traded relative to its four BEGOS peers, without regard for fundamental undervaluation:
That noted, from the "We Love Symmetry! Dept." here is the percentage change comparison of the price for Gold across the last 21 trading days (one month) versus that of the S&P 500. That is near perfection for mirrored negative correlation:
Economically, 'twas not a great week with stagflation running ahead. February saw U.S. retail inflation increase another +0.8%: such recent levels haven't been seen since just prior to the FinCrisis starting in 2008. And although Wholesale Inventories were worked off, the following metrics all were worse month-over-month: Consumer Credit, the Treasury Deficit, the Trade Deficit, and the University of Michigan's Sentiment Survey. Stagflation + Invasion = Unhappy S&P:
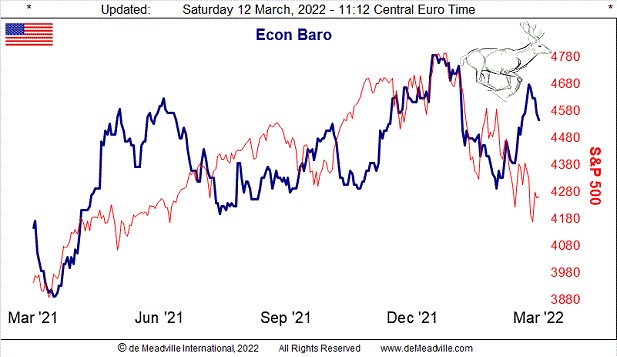
That noted, the S&P's Moneyflow lacks fear, and the Index itself is near-term oversold; thus should it bounce and the negative correlation with Gold hold, watch for the yellow metal to work lower still.
Meanwhile, the European Central Bank after postulating they shan't raise rates in 2022 is now preparing to so do, President Lagarde pointing to inflationary pressures arising given the RUS/UKR war. 'Course StateSide where we just were, not drilling for Oil combined with banning imports from RUS means not driving anymore, short of getting an electric vehicle. ("Got Coal?")
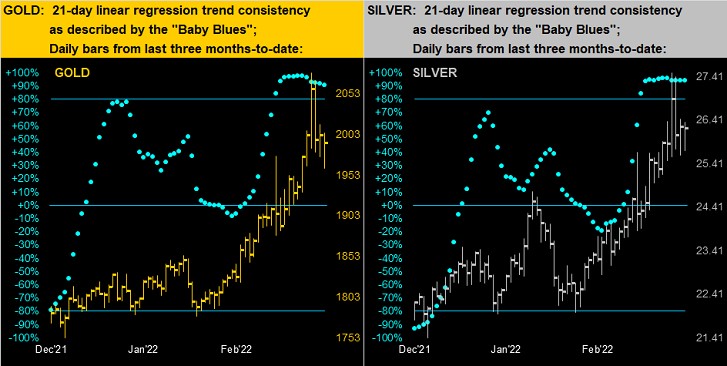
What we've got here are at least momentary price toppings for both Gold and Silver. In turning to their daily bars from three months ago-to-date for the yellow metal on the left and for the white metal on the right, the two panels are fairly identical as are their "Baby Blues" patterns reflective of trend consistency. And typically when those blue dots are "crawling across the ceiling" like this, the uptrend has been firm, but may turn fragile as profit taking ensues, especially should "The M Word" crowd rear its manipulative short-sided head:
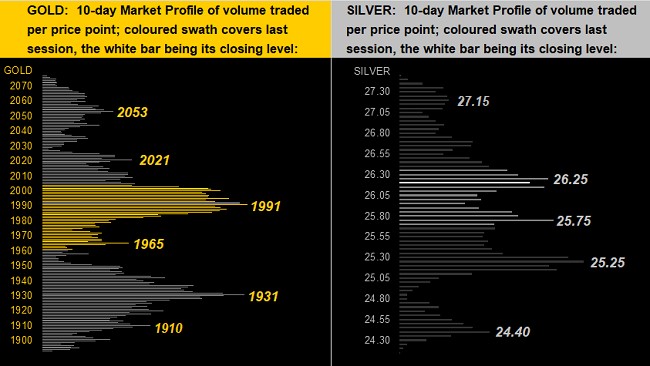
As for their 10-day Market Profiles, both Gold (below left) and Silver (below right) are fairly centered therein with overhead trading resistance and underlying trading support as labeled:
All of which summarily brings us to:
The Gold Stack
Gold's Value per Dollar Debasement, (from our opening "Scoreboard"): 4053
Gold’s All-Time Intra-Day High: 2089 (07 August 2020)
2022's High: 2079 (08 March)
10-Session directional range: up to 2079 (from 1892) = +187 points or +9.9%
Gold’s All-Time Closing High: 2075 (06 August 2020)
Trading Resistance: 2021 / 2053
Gold Currently: 1992, (expected daily trading range ["EDTR"]: 48 points)
Trading Support: 1991 / 1965 / 1931 / 1910
10-Session “volume-weighted” average price magnet: 1974
The Gateway to 2000: 1900+
The Weekly Parabolic Price to flip Short: 1863
The 300-Day Moving Average: 1809 and rising
The Final Frontier: 1800-1900
The Northern Front: 1800-1750
2022's Low: 1779 (28 January)
On Maneuvers: 1750-1579
The Floor: 1579-1466
Le Sous-sol: Sub-1466
The Support Shelf: 1454-1434
Base Camp: 1377
The 1360s Double-Top: 1369 in Apr '18 preceded by 1362 in Sep '17
Neverland: The Whiny 1290s
The Box: 1280-1240
Here are three quick quips to wrap:
■ On Wednesday (16 March) the Federal Open Market Committee shall vote unanimously to raise their Bank's Funds Rate -- and well too its Discount Rate -- for the first time since 19 December 2018. But given the current geo-political crisis, we were considering titling this week's missive as "Is The Fed About To Balk?" Just a thought.
■ This just in from the laughable "Where've They Been? Dept.": according to Bloomy, "Morgan Stanley and Citi Strategists See Equities Storm Forming". Just sweep around them, they'll catch up; obviously by our "live" S&P price/earnings ratio of 33.6x -- 50% above the historical mean -- earnings still aren't there to support current price.
■ We read that the price of Nickel gained +227% in less than three weeks, indeed reaching $100k/tonne on the London Metals Exchange. So search around under those old sofa cushions and you too might come up with a tonne of nickels. Just sayin'.
'Course, a tonne of Gold ($70M) shall get you farther up the stagflation road!
www.deMeadville.com
www.TheGoldUpdate.com
*******
share
share
share
share
share

Mark Mead Baillie has had an extensive business career beginning in banking and financial services for two years with Banque Nationale de Paris to corporate research for three years at Barclays Bank and then for six years as an analyst and corporate lender with Société Générale.
For the last 22 years he has expanded his financial expertise by creating his own financial services company, de Meadville International, which comprehensively follows his BEGOS complex of markets (Bond/Euro/Gold/Oil/S&P) and the trading of the futures therein. He is recognized within the financial community of demonstrating creative technical skills that surpass industry standards toward making highly informed market assessments and his work is featured in Merrill Lynch Wealth Management client presentations. He has adapted such skills into becoming the popular author each week of the prolific “The Gold Update” and is known in the financial website community as “mmb” and “deMeadville”.
Mr. Baillie holds a BS in Business from the University of Southern California and an MBA in Finance from Golden Gate University.


