Gold Focusing On May Cycle Bottom


Through my cycle work in the market, there is a current focus on the month of May to end up as our next decent swing low for the Gold market, with several mid-term cycles pinpointing this timeframe for a potential market bottom.
One of the more widely-followed cycles in the Gold market is the 20-week (approximately 100 trading days) cycle, which last bottomed back on December 12, 2017, doing so at the 1249.30 figure (continuous contract numbers). In using our cycle detrend, we can isolate this particular wave, which is shown on the chart below:
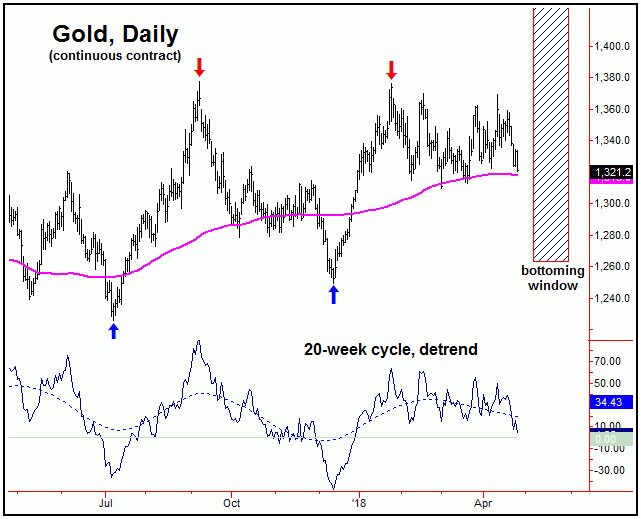
While there is no particular downside price target for the downward phase of the 20-week cycle, our current assumption is that it should end up as a countertrend affair against its prior bottom, which, as noted above, is the December, 2017 trough of 1249.30 (continuous contract). If this does end up as correct, then the probabilities are above-average that a push above the 1376 swing top (from January) will be seen on the next upward phase of this 20-week wave.
In terms of time, we publish turning points for Gold in our reports, with the next one of focus currently set for May 4th of this year, but which is plus or minus a day or two in either direction. With that, there is some focus on this date to mark the next decent low for the metal, if the recent decline lasts into that timeframe.
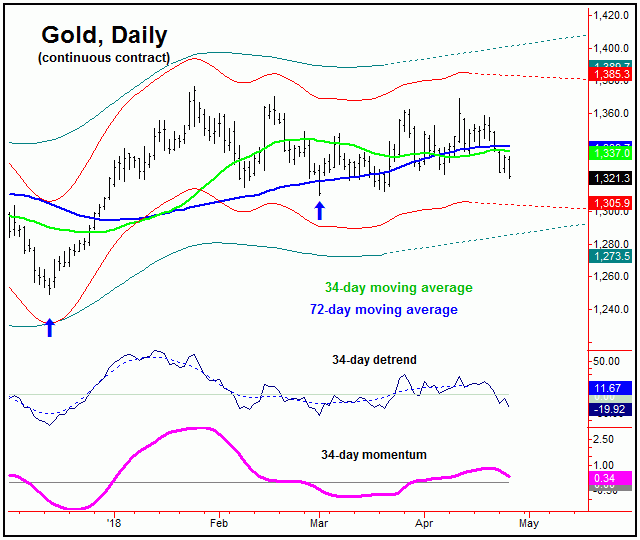
For the very short-term, the most dominant cycle for Gold is the 34-day wave, which is shown on the chart above. This wave has been seen as pointing south, ideally into the early-May timeframe, where it should end up bottoming the larger 20-week and 72-day cycles, with the latter shown on our next chart. On our chart, we can see that both our detrend and momentum indicators are declining, thus having confirmed our assumption that this 34-day wave was heading south in the near-term.
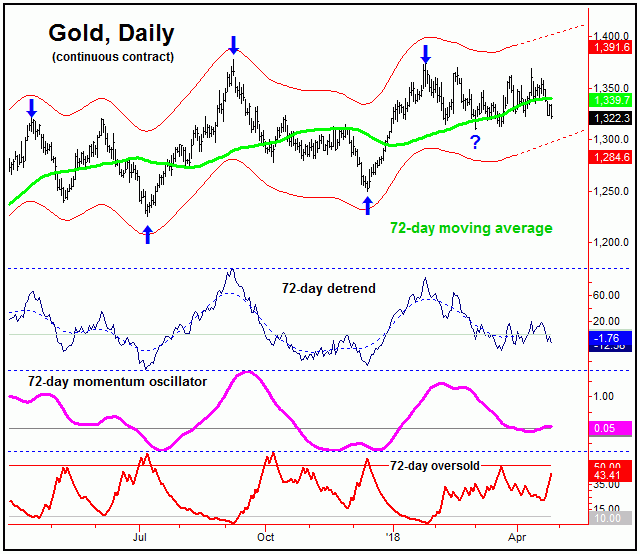
As for the 72-day cycle (chart, above), in order for this wave to actually confirm its bottom to be set in place, Gold would currently need to see a reversal back above the 1370.80 figure (continuous and June, 2018 contract). That has yet to materialize, with the recent spike up to the 1369.40 level able to contain that action, which has given us our favored path for a May price/time bottom. Ideally, we would like to see our 72-day ‘oversold’ indicator moving above its upper reference line as this wave troughs (note: this indicator reacts inverse to price action), something it has yet to do.
Stepping back, once the next 72-day and 20-week cycle trough is set in place, then a rally in the range of 8-16% should play out into the Summer months. That is, the normal low-end statistical rallies with these waves have been at least 8% off the bottom, while the average has been closer to 16%. Thus, we have some idea of what to expect going forward, once these cycles do low-out.
Lastly, in taking a look at our indications from sentiment, our proprietary Gold sentiment index (chart, below), divergences with this indicator have shown to good signals for mid-term turns in the Gold market, with the last of these coming back in February:
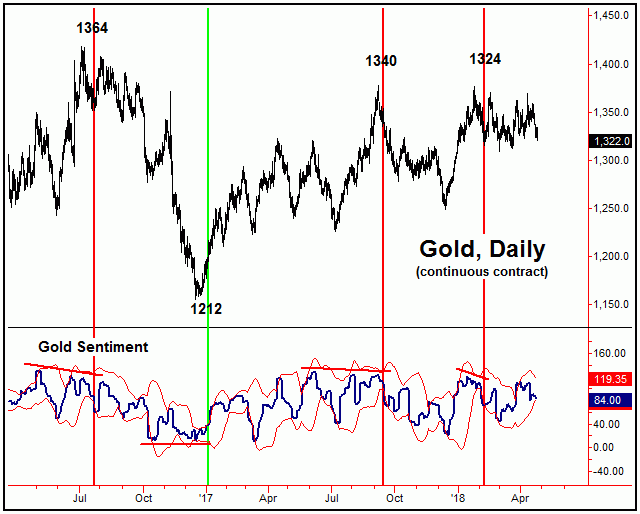
Once the mid-term signals develop, we have found that a daily close above or below standard-deviation bands to be good secondary signals for Gold. In other words, with our main trend indicator down, a close above the upper standard-deviation band normally occurs near price tops. The last such signal came on 3/26/18, with the metal trading at the 1360 figure.
Right now, we are waiting to see if another mid-term buy signal should develop in the days/weeks ahead, with our last mid-term signal to the buy side with sentiment coming back on 1/5/17 at the 1212 figure. All said then, there is some focus now on a potential May bottom for Gold, with the next key date of focus being the May 4th timeframe, plus or minus, where we will be keeping a close eye on the accompanying action with technicals - and with our indications from sentiment.
Jim Curry
The Gold Wave Trader
*********
Jim Curry is the editor and publisher of The Gold Wave Trader, which specializes in the use of cyclic and statistical analysis to time the Gold market. He is also the author of several trading-related e-books, including ‘The Volatility Reversal Method’, also ‘Cycles & Moving Averages’. He can be reached at the URL above.


