Gold Forecast: Final Low Targets For The Bear Market


 In our previous article covering the long-term gold forecast, we made the case that the breakout in gold from the 1980 - 2009 consolidation below $850/ounce represents an extremely rare and powerful pattern in the commodity markets, a move that is likely to lead to decades of gains once the current bear market is over.
Given the recent weakness in the price of gold, we thought it a good time to update readers on our expectations for the final low of the current bear market. There is a confluence of no less than five important support levels between $850 and $1,033/oz. that we believe should provide support for the price of gold should further weakness develop over the months ahead. Such a final low would represent the best entry point for gold investors who have been waiting on the sidelines for prices to begin trending higher again.
The Power of Multiple Support Levels
In our technical studies, when a single support level exists for a market, we will often say simply that support exists at that specific price point. When two support levels come in near the same region, we will say that this represents strong support at that area. And when three separate support levels exist in the same vicinity, that represents an extremely strong level of support.
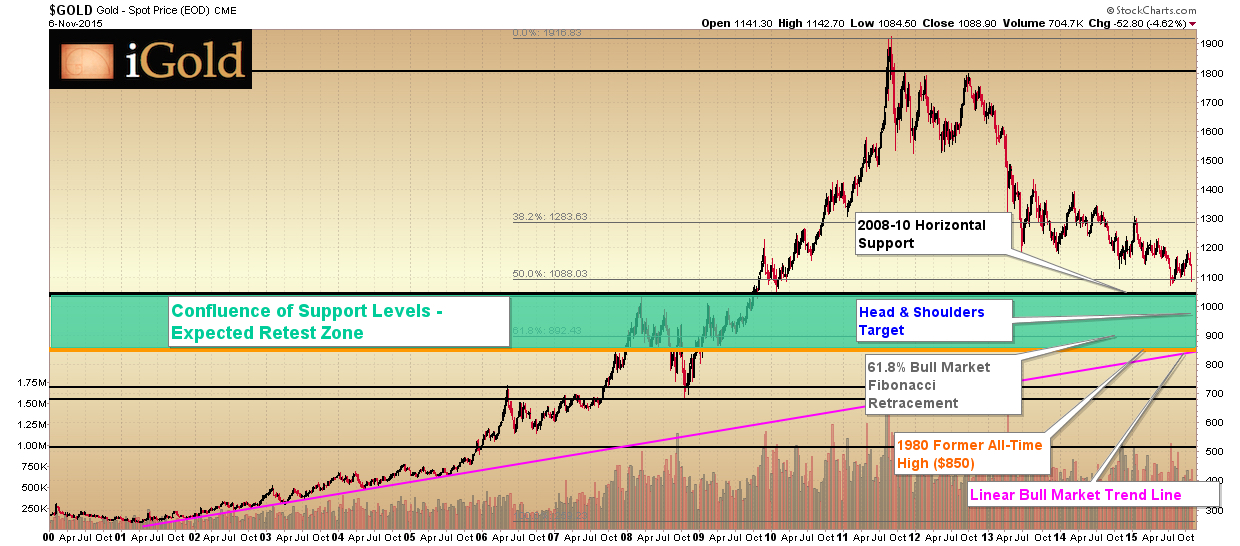
On our 15-year gold chart, there now exist five separate support levels currently within a swath of roughly $180. This represents an immense level of buying power which should enter the gold market within this region. While the range may be too large for short-term traders to use in timing, for long-term investors who agree with our thesis that prices may eventually reach a multiple of the 2011 $1,917 high, any purchases in this band of support should represent an excellent long-term accumulation point.
Gold Final Low Levels
The support levels are as follows, and can be seen from top to bottom on the chart above. Note that all of the prices fall within the highlighted green band:
1) The 2008 - 2010 horizontal support, at $1,033. This level was first hit in March of 2008 amidst the Bear Stearns collapse, and then held the price of gold down for two more attempts over the next year, before finally giving way to demand in September 2009. The former resistance level subsequently acted as support in January of 2010 and the market has never traded lower since. Labeled in black on our main chart, this level may be extended downward to include the psychologically significant $1,000 price.
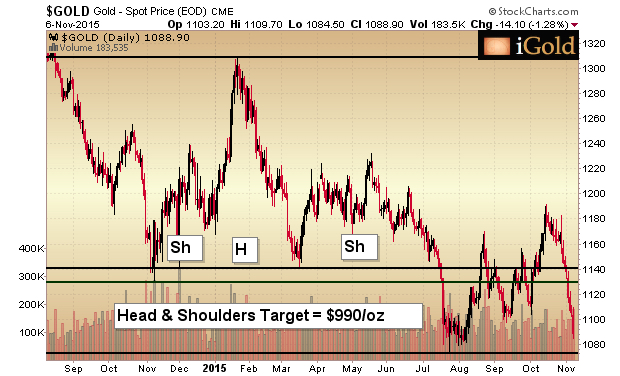
2) The head and shoulders target of $990, derived from the pattern forming over the last 12 months, as shown below, and labeled in blue on our main chart.
3) The 61.8% Fibonacci retracement of the entire bull market level comes in at $892, and is shown in gray on the main chart above. This level is the largest Fibonacci percentage drop that we consider to be valid for a commodity to still be in a primary bull market. For those who have not studied him, Fibonacci was an Italian mathematician of the Middle-Ages, who discovered that certain ratios repeat in thousands of different examples in nature, from snail shells to hurricane systems to rose petals. Markets, being a sum of human nature, tend to reflect these ratios similarly in their retracement levels.
4) The 1980 former all-time high that held the market until 2008-09 comes in at $850 and is expected to provide the last level of support this market might need, shown in gold on the main chart above.
5) The linear bull market trend line, extending back to 2001, which served as support through 2005 before gold prices began to rise more rapidly, comes in also at the $850 price level when extended through the present. This is shown in magenta on the main chart.
Takeaway on Gold Prices
In summary, it looks as though a retest of the August bear market low of $1,075 is imminent. Should prices fail at that level, there is an extremely strong confluence of support between $850 - $1,033. Once prices begin to enter this zone, we will provide further updates as we gauge the development of the final low.
Yes, the bear market has been long and grinding-- but we are closer to the end of it than the beginning. For those who have been waiting to accumulate gold, your best opportunity looks to be arriving soon.
********
To view our latest video update on the action in gold and silver, you may watch our free video on our website [LINK: http://igoldadvisor.com/2015/11/05/gold-price-analysis]. We post regular video updates twice per week.

Christopher Aaron began his career as an intelligence analyst for the CIA and Department of Defense. He served two tours to Afghanistan and Iraq between 2006 - 2009, conducting pattern-of-life mapping for military leaders.
Mapping shares similarities with technical analysis of the financial markets because both involve the interpretation of repeating patterns found in human nature. He is the founder of iGold Advisor, providing independent research and analytics on all aspects of the precious metals markets.
He speaks regularly on the cyclical patterns found within the financial markets and on international policy. He has been featured in the New York Times and NPR news amongst other financial publications.


