Gold Forecast: Gold In Bottoming Range, Prepping For Next Rally


The action into last week saw gold forming its low in Monday's session, here doing so with the tag of the 1851.10 figure. From there, strength was seen into late-week, with the metal running all the way up to a Friday peak of 1923.60 - before backing slightly off the same into the weekly close.
Gold Cycles into Bottoming Range
As noted in past articles, the correction off the 2089.20 swing top - registered back in early-August - has come as a result of one of the more dominant cycles that we track, the 72-day wave. Here again is that cycle, shown on the chart below:
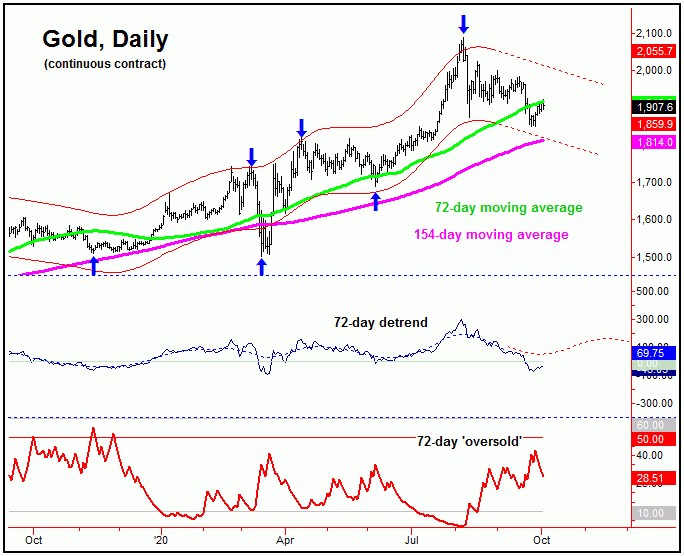
On the above chart, we can see the detrend's projection for a trough with this wave - which has been due around the late-September timeframe, though with a good plus or minus variance in either direction, simply due to the size of this cyclical component.
Going further with the above, any cycle of any length will carry an average variance of around 20% in either direction. With that, our 72-day wave will have a normal plus or minus variance of around 14 trading days in either direction - which is an approximate 'window' where we should expect its bottom to form.
While it is always possible that our 72-day trough has already been seen, in order to actually confirm an upturn with this wave, gold would currently require a reversal back above the 1985.10 figure (December, 2020 contract). Thus, we can say that the mid-term correction phase that began back in August will remain intact, as long as any near-term rallies are able to remain below that key number.
The markets are only semi-predictable, at best, even with the suggestions from the various time cycles. The highest predictability from the cycles actually comes from the statistical and pattern inferences from each wave, which we do find to be correct the greater-majority of the time. For example, we have shown the tendency for a cycle to revert back to a moving average of the same length better than 85% of the time, on correction - or rally - phases.
With the above said and noted, our analysis called for a minimum drop back to the 72-day moving average on the most recent correction phase of the 72-day cycle - which we have easily seen met. Once the minimum conditions are met, and the larger trend is still pointing up, we then make use of price ‘reversal points’ (a proprietary methodology) to trigger the next upward phase to be back in force.
With our 72-day cycle, until a lower level materializes, as noted gold would currently need to reverse back above the 1985.10 figure to confirm a mid-term trough in place. The good news is that this number will continue to drop going forward, with the most current numbers noted in our Gold Wave Trader market report.
Take a look at the next chart:
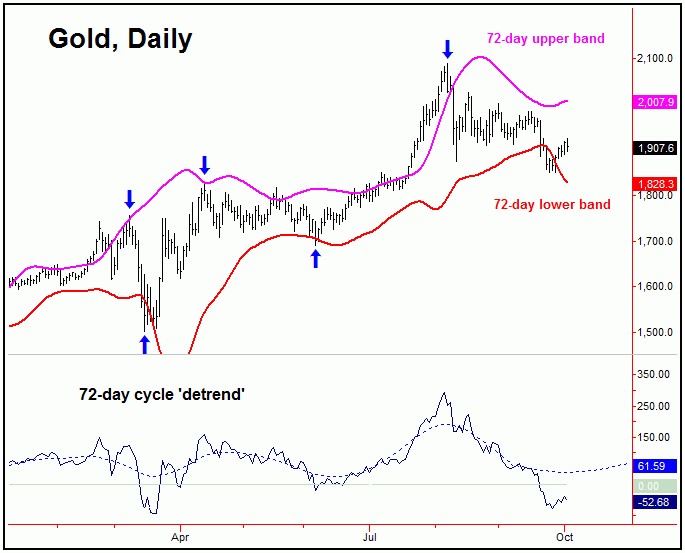
The chart above shows our 72-day cycle once again, though this time with our 72-day 'bandwidth' indicator overlaid. On correction phases, we expect the 72-day lower band to act as a magnet (in addition to the 72-day moving average). Conversely, on rally phases of this wave, we expect the upper band to act as a magnet. With that, we can get an early idea of where the next upward phase will take prices, with the upper 72-day band currently at the 2007 figure - though this number is moving daily.
Having said the above, since we are still in the plus or minus window for a 72-day low to form, there is still the potential for lower lows for this wave - at least until a reversal back above the 1985.10 figure is seen. As mentioned last weekend, there is a 'black hole' window - which is an approximate date where the bottom for the entire swing down is likely to materialize - if a lower low is still out there.
Due to subscriber commitments, I can't give out our 'black hole' date. Having said that, I can suggest that if a drop back below the 1851.00 swing bottom is seen at any point going forward, then that move would be the odds-on favorite to trough the larger swing down.
In terms of patterns, the overall assumption has been that the correction off the August peak would end up as a countertrend affair - holding above the June trough of 1691.00. Going further, support has been noted at the lower 310-day channel line, with this chart shown again below:
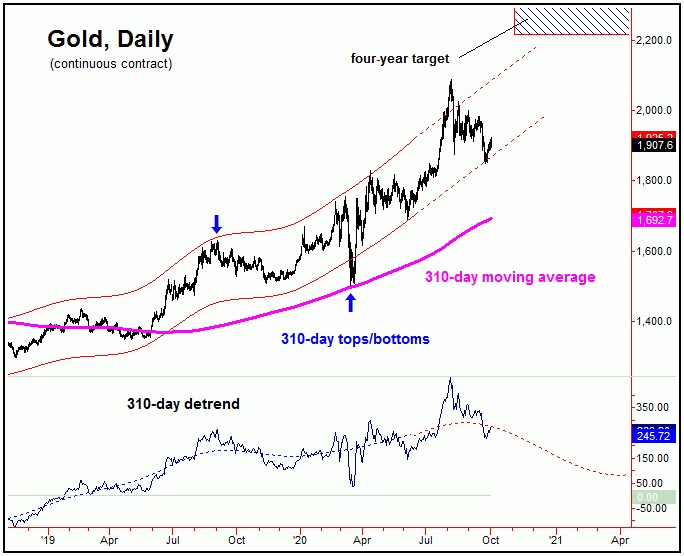
With the above chart, we can see that the recent decline has made a tag of our 310-day lower channel boundary. This channel line is extrapolated, and thus there is a plus or minus variance with price, though the overall suggestion is that the recent correction has already met any minimum price and time assumptions. Right now, we are simply waiting to see if there is a lower low into our 'black hole' date - or whether the move down is confirmed to be set in place.
For the bigger picture, the ideal path is looking for an eventual push up to the open four-year target to 2212.00 - 2340.56 for gold, with the upper-end of this range also acting as a major resistance level. That is, if tested, a move into this range looks primed to peak the larger 310-day cycle, for what is expected to be a sharp correction into the Spring of next year - though that decline is favored to end up as a countertrend affair, giving way to higher highs into the Autumn of next year.
The Bottom Line
The overall bottom line is that the correction that began back in August is close to running its course. If the larger time cycles are correct, then what follows should be a push back to new all-time highs for gold in the coming months, a move which should be the technical setup for a much more important peak. From that high, we expect a sharp correction into the Spring of next year, before turning back to higher highs on the following mid-term upward phase into the late-2021 timeframe or beyond.
Jim Curry
The Gold Wave Trader
http://goldwavetrader.com/
http://cyclewave.homestead.com/


