Gold Forecast: Gold Bottoms Right Into 'Kill' Zone


 With the action seen into last week, Gold has turned sharply back to the upside - with the metal having been anticipated to form a low into the 'kill zone' turn, which was identified in our Gold Wave Trader report as the October 9th date, plus or minus.
Stepping back, there is now the potential for a mid-term bottom also in place with the metal, though this would need to be confirmed.
With the above, we need a quick recap of the action seen over the past month.
From my 9/17/23 article for Gold-Eagle: "the rally with the 20-day cycle is expected to be a countertrend affair, holding below the 2029.20 swing top, seen back in July. From a late-September peak, the ideal path would be looking for another decline into October, where our larger 72-day wave is projected to trough. In terms of price, a drop below the 1913.60 swing bottom would be ideal as our 72-day wave next bottoms, a move which would be the technical setup for our next mid-term low for Gold."
Back in mid-September, I mentioned that the upward phase of our 20-day cycle was in progress, though with the ideal path looking for a countertrend rally with that wave - one that held below the July peak; this did end up as the case.
From there, a drop back below the 1913.50 swing bottom was favored to play out into our 'kill zone' date of October 9th, which was easily seen with the following action - with the metal spiking down to a low of 1823.50, bottoming on October 6th - within one trading day of our turn date.
Near-Term Picture for Gold
For the short-term view, as noted above, the last low for our 20-day wave was the October 6th bottom of 1823.50 (December, 2023 contract) for Gold - which was later confirmed by the subsequent reversal back above the 1849.40 figure, a number noted in advance in our Gold Wave Trader report.
Here again is that 20-day cycle, updated to the current action:
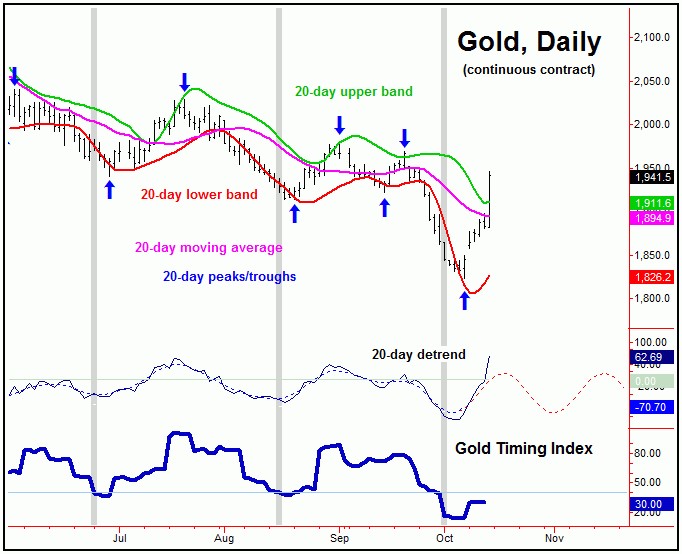
In terms of time, our 20-day cycle is some 5 trading days along on its current upward phase, and thus is moving back into the early-end of its topping range - though this seems likely to come from higher numbers than already seen.
Adding to the notes above, of keen interest is that our Gold Timing Index (lowest pane, in dark blue) has yet to see a sharp spike higher with the recent rally - which is viewed as a net positive, as it suggests the market has some room to run before the next 20-day top attempts to form.
Of additional note is that our Gold Timing Index recently dropped below the 40 figure just prior to our October 9th turn date. In our market report, we noted that prior drops below the 40 level occurred just prior to key bottoms in the Gold market, with the most recent one being no different.
With the above said and noted, our upside 'reversal point', as mentioned earlier, was set at the 1849.40 figure for Gold, and - since taken out - has given way to nearly 100 points of additional rally through the same.
For the very short-term, there is also a smaller 10-day wave for Gold, which is shown on our next chart:
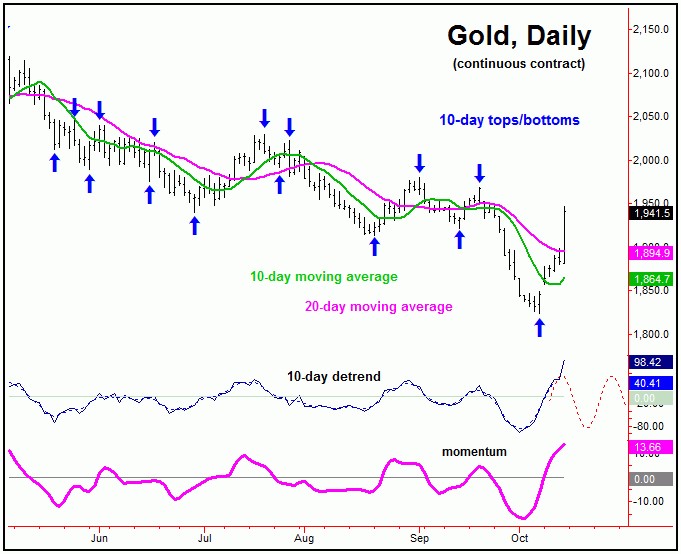
Our smaller 10-day wave is also 5 trading days along, and with that is looking for a smaller-degree peak in the next day or three. Once this wave does top, a quick drop back to the 10-day moving average would be a normal-enough affair. In terms of patterns, that decline would now seem favored to end up as countertrend.
Gold's Mid-Term View
With the above said and noted, do we have a mid-term low in place for Gold? There is now the potential for this to be correct, simply due to the configuration of our larger 72 and 310-day cycles - with the smaller 72-day wave shown below:
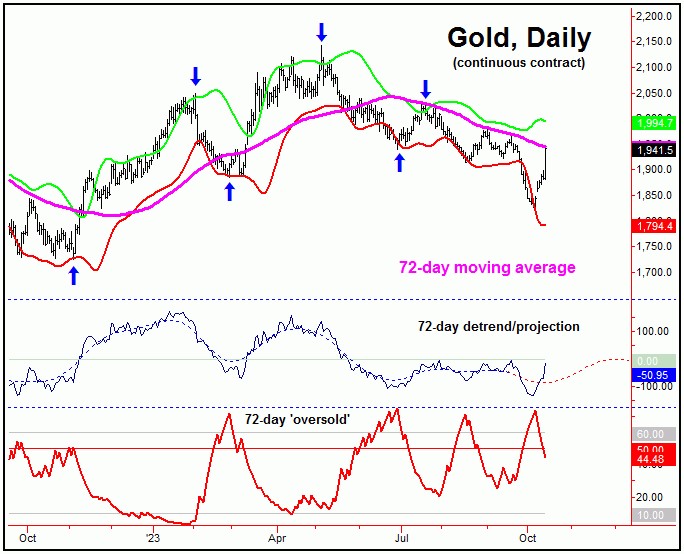
As mentioned back in September, our 72-day cycle was pointed south into October, which favored lower lows into that timeframe - which we have obviously seen. In looking at the action from our detrend, the suggestion is that the 1823.50 swing low is likely to end up as our trough for this wave.
Even with the sharp spike higher into Friday's session, an upturn in our 72-day component would still need to be confirmed by additional price action, by taking out our current upside 'reversal point' for this wave - with the exact number identified in our thrice-weekly Gold Wave Trader report.
Taking out our reversal point to the upside is now key, as the average rallies with our 72-day wave - when coming off the pattern of a ‘lower-low’ (which it had to have recently formed) have been approximately 15.7% from trough-to-peak. In other words, if the 1823.50 low was the bottom for our 72-day component, there would be the potential for a push up to the 2109 figure in the coming weeks/months.
Having said the above, there would actually be an even greater potential for further strength than noted, due to the position of our next larger wave, the 310-day cycle:
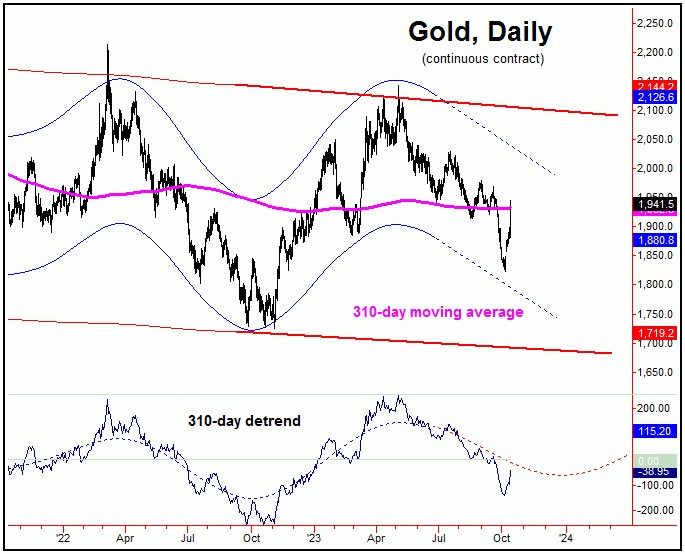
From my 9/17/23 article: "The last bottom for our 310-day cycle was seen back in November of 2022, forecast well in advance in our Gold Wave Trader market report. The downward phase of this 310-day wave is currently deemed to be in force, and with that is pushing south into the Autumn of this year. This low is not to be missed, as what follows should be another rally of some 20-25% or more in the Gold market, playing out into next year."
As far back as June of this year, we were able to confirm a turn south with our 310-day cycle, with that wave having been projected to bottom around the Autumn of this year. What followed was a correction of nearly 15% off the top for the metal, which is a normal percentage decline with this wave.
As mentioned earlier, there is the potential for a mid-term bottom in place for Gold, though it needs confirmation. Having said that, should the 1823.50 figure end up as this low, then there would be at least the potential for a push up to the 2279 figure into the Summer next year.
The above is due to the fact that the average upward phases with this 310-day cycle have seen Gold rising some 20-25% off the bottom. Whether we will see that higher range here is more speculation, though - with an economic recession appearing to be in the cards - this would seem very supportive of mid-term strength for the metal.
The Bottom Line
The overall bottom line with the above is that Gold troughed right into our 'kill zone' turn, and with that there is the potential for a larger-degree low to have formed. However, that action needs additional confirmation, by taking out a key price reversal level, with precise details noted in our Gold Wave Trader market report.
Jim Curry
The Gold Wave Trader
http://goldwavetrader.com/
http://cyclewave.homestead.com/
*******
More from Gold-Eagle


