Gold Forecast: The Gold Bulls are Back in Town


 Since my last article from late-June, Gold has seen the anticipated bottom - with its next upward phase currently deemed to be in force. The current rally should have further to run, though is anticipated to end up as an eventual countertrend affair.
Gold's 72-Day Cycle
From the comments made in recent articles, the last key low was due to form for Gold - expected to come from our 72-day time cycle, shown again below:
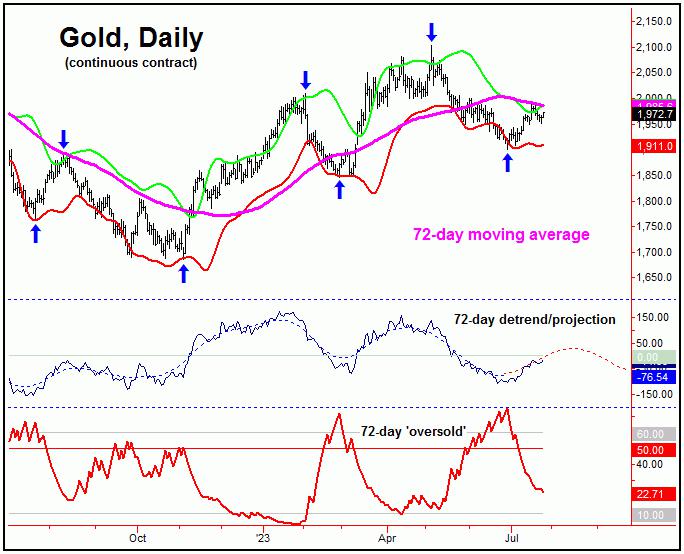
From my 6/25/23 article: "our detrend analysis with this (72-day) wave suggested that it would be headed lower into mid-June or later, where its next low should try to form. Adding to the above, our 72-day 'oversold' indicator has recently spiked above its upper reference line, which is something we would expect to see on or before this wave bottoms out."
As mentioned above, the last trough for our 72-day wave was originally projected for the mid-June timeframe, but with a decent plus or minus variance in either direction - simply due to the size of this cyclical component.
In terms of price, it was the subsequent reversal back above the 1952.00 figure (August, 2023 contract) which told us that our 72-day wave had likely bottomed out - and with that was headed higher into the late-July to mid-August timeframe.
In terms of price, the recent rally has easily made it back to the 72-day moving average - which is always our minimum assumption. Having said that, a the greater-majority of the upward phases of this wave - when coming off a 'higher-low' - have seen rallies of 8.1% off the bottom, which should favor additional strength in the coming weeks.
With the above said and noted, if Gold remains on firm ground into August, then we will want to keep an eye on our 72-day 'oversold' indicator (lowest pane, in red). That is, a spike back below its lower reference line - if seen at any point going forward - would be our indication this wave is topping once again, for what is expected to be another sharp decline into September - November.
Gold, Short-Term
For the short-term picture, the downward phase of the 10 and 20-day cycles has been in force in recent days. Here is the smaller of these two waves, the 10-day component:
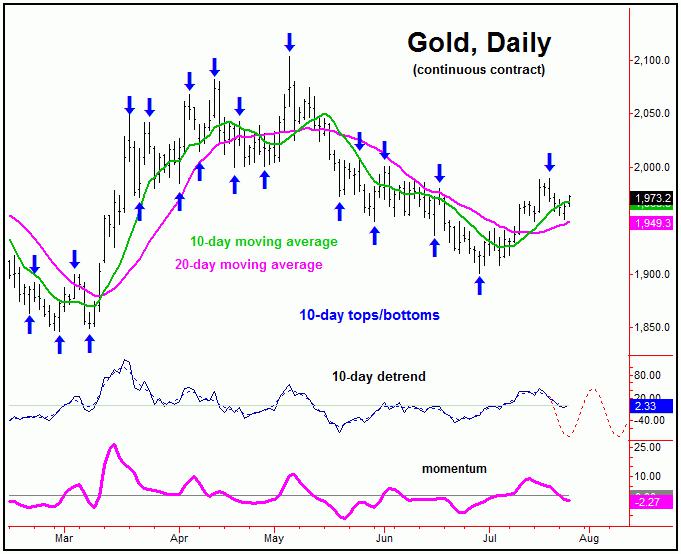
In terms of patterns, due to the position of the aforementioned 72-day cycle, the probabilities strongly favor the correction with the smaller 10 and 20-day cycles to end up as a countertrend affair. If correct, a push back above the most recent high of 1989.90 should be seen on the next minor swing to the upside.
Going further with the above, if the upward phase of our 72-day wave is to remain intact, we should see a series of higher-lows and higher highs, coming from the smaller 10 and 20-day cycles.
Gold's Bigger Picture View
Stepping back, however, as mentioned earlier, the current upward phase of our 72-day cycle is anticipated to end up as an eventual countertrend affair - holding below the 2100.40 swing top from back in early-May. If correct, the probabilities will favor a drop back below the 1900.60 figure into September - November, before forming our next mid-term low - coming from our larger 310-day component, shown below:
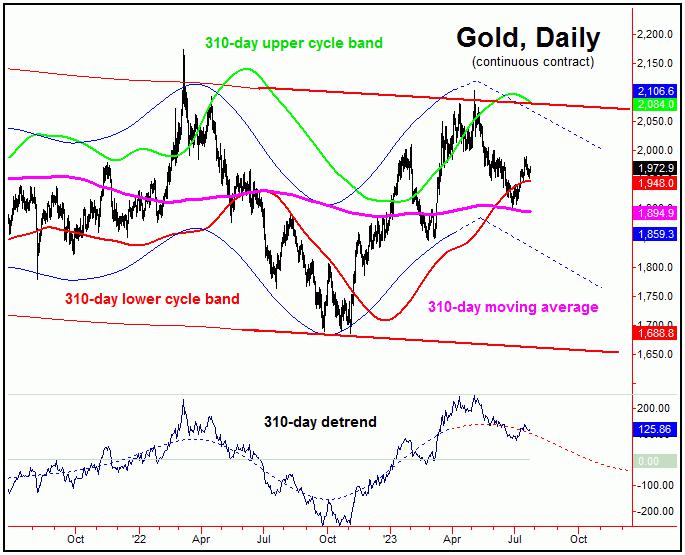
For the longer-term view, from whatever low that does form with our 310-day wave in the coming months, the probabilities should favor a sharp rally of some 20-25% or more on its following upward phase. In terms of time, that rally seems favored to last well into the Summer of 2024 or later, before looking for yet another mid-term peak with this same 310-day wave.
Jim Curry
The Gold Wave Trader
http://goldwavetrader.com/
http://cyclewave.homestead.com/
********


