Gold Forecast: Gold Cycle And Technical Update


Last week's trading saw gold forming the more bearish pattern of an early-day high into resistance, with the metal hitting a peak of 2001.20, made on a Tuesday time top. From there, lower prices were seen into late-week, here dropping down to a Friday bottom of 1921.60 - before bouncing slightly into the weekly close.
Gold's Short-Term Outlook
From the comments made in recent articles, the mid-term picture is seen as higher overall for gold, though with a series of corrections due to play out in-between. The most recent of these corrections has come from the 34-day cycle, which is shown on the chart below:
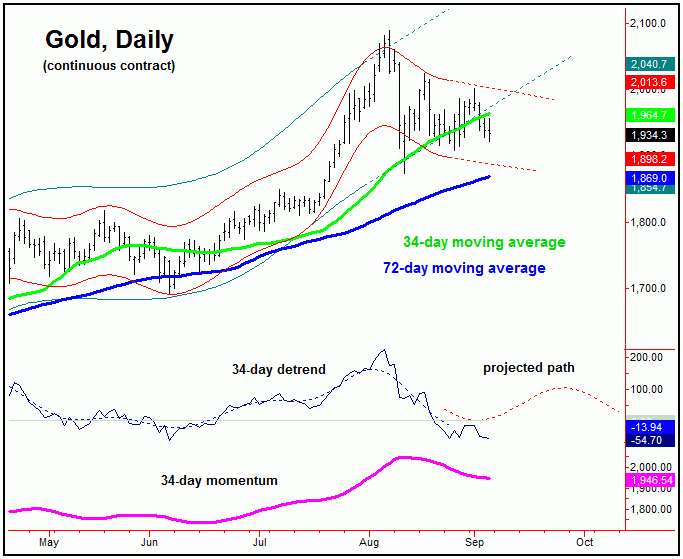
In terms of time, the detrend that tracks our 34-day wave was projected to push lower into the late-August to early-September timeframe - which we are at or into. In terms of price, however, there is a decent shot that the 1874.20 figure will end up as the low for this component, though this has yet to be confirmed.
With the above said and noted, any reversal back above the 2002.40 figure (December, 2020 contract) would confirm our 34-day cycle to have turned back to the upside, a number which could continue to drop going forward, depending on the action - with the latest numbers always noted in our thrice-weekly Gold Wave Trader market report.
Going further with the above, as long as prices hold below the 2002.40 figure, then the odds will favor additional weakness into early this week, before the next short-term bottom attempts to form. Stepping back, the next upturn in this 34-day cycle is expected to give way to a decent bounce/rally into around mid-September.
The Mid-Term View
For the mid-term picture, the overall assessment favors the weakness off the 2089.20 swing high to end up as an eventual countertrend affair - with the decline off the top seen as an Elliott wave '4'. If correct, the next move up should give way to wave '5' of the move, before peaking the larger swing up.
The chart below shows the larger 310-day cycle, which is projected higher into at least the late-October timeframe of this year:
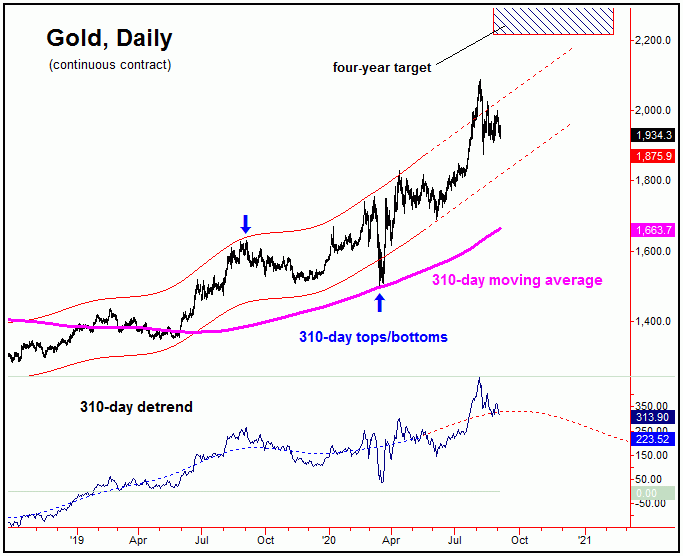
As mentioned in prior articles, in bullishly-trending markets, price will normally peak on or well past the detrend's projected path. If that is correct, then higher highs should follow the current correction phase with the smaller-degree cycles. Going further, the next mid-term peak - and thus the next larger decline phase - should come from this same 310-day component.
In terms of price, overlaid on our 310-day chart is our open target from the larger four-year cycle, which is to the 2212.00 - 2340.56 region for gold. With that, the ideal path is looking for the current decline to end up as an eventual countertrend affair - though it could have more to go before bottoming. Once complete, however, the probabilities will favor a move into the four-year target zone into the Autumn of this year or later - where we will need to be looking for the next 310-day top to form.
Technical Indications
As pointed out in prior articles, our Mid-Term Breadth index began to show a divergence against price back in late-July, and with that warned that a sharp decline was brewing. Here again is our chart, showing this particular indicator:
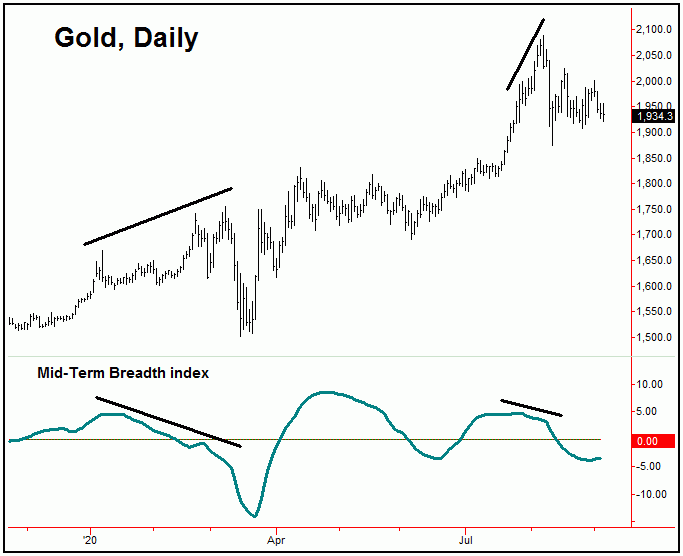
With the action seen into last week, our Mid-Term Breadth index has now managed to turn higher - and with that is back to being viewed as a net positive going forward. Even said, due to the configuration of the smaller-degree time cycles, there is still the potential for additional price weakness in the near-term - though I now view the position of breadth as a bullish indication, and with that we should be favoring the buy side of the market going forward - at least until the above should change.
The Bottom Line
The overall bottom line is that gold is in a short-term countertrend correction - against what is viewed as a mid-term uptrend, with our larger 310-day cycle. If correct, upon completion of the decline, the metal should make an eventual push up to the 2200's or better in the coming months, before the next mid-term peak forms. From that peak, we are expecting a much larger percentage decline to play out into the Spring of next year, where our next mid-term trough is projected. Stay tuned.
Jim Curry
The Gold Wave Trader
http://goldwavetrader.com/
http://cyclewave.homestead.com/


