Gold Forecast: Gold Cycle Bottoming, Larger Rally Coming


 Gold's Cyclical Picture
As per my articles posted back in September, the mid-term cycles for Gold were seen as heading south into mid-October or later, where the next key low was expected to form. With the action seen since, Gold has continued to make lower lows for the move into that mid-October timeframe, with the metal spiking down to a bottom of 1621.10, registered back on October 21st.
In-between, we expected a short-term low to form with our 34-day cycle, which is shown on the chart below:
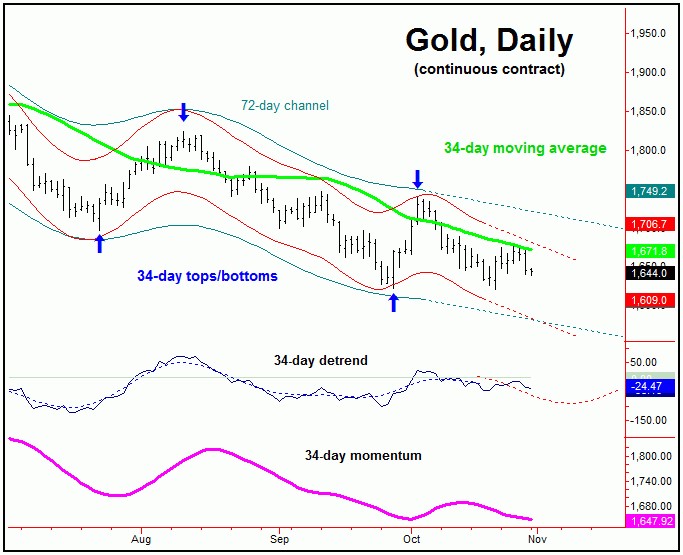
In terms of price, our analysis called for a rally back to the 34-day moving average on the most recent upward phase of this wave, which played itself out into early-October. In terms of patterns, due to the position of the larger 72 and 310-day cycles, our assumption was that this rally would end up as countertrend, and with that would turn back to make lower lows into mid-October or later.
With the above said and noted, our 34-day cycle is moving back into bottoming range, and is now set to trough the larger-degree 72 and 310-day cycles, from which a larger percentage rally is expected to unfold in the months ahead.
The chart below shows our 72-day cycle:
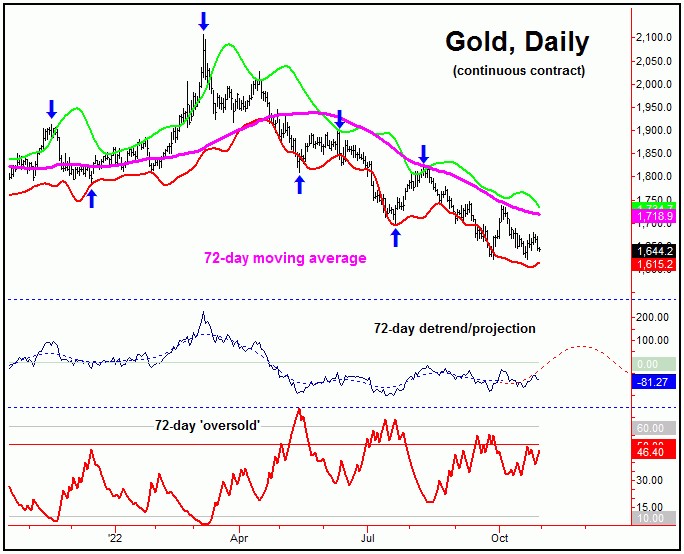
In terms of time, the trough for our 72-day wave was originally forecast for the mid- October timeframe, but does have a decent plus or minus variance in either direction - simply due to the position of the even-larger 310-day component (more on this in a bit). So far, as mentioned, the lowest low was made back on October 21st, and thus there is at least some potential this trough could have already formed.
As per the 72-day cycle's detrend projection, the metal is looking for a sharp rally in the coming months, coming as a result of the upward phase of this wave - as well as from the larger 310-day cycle.
Gold's Technical Picture
From the comments made in past months, the next bottom of significance has been expected to come from the combination of 72 and 310-day cycles - with the larger 310-day cycle shown again on the chart below:
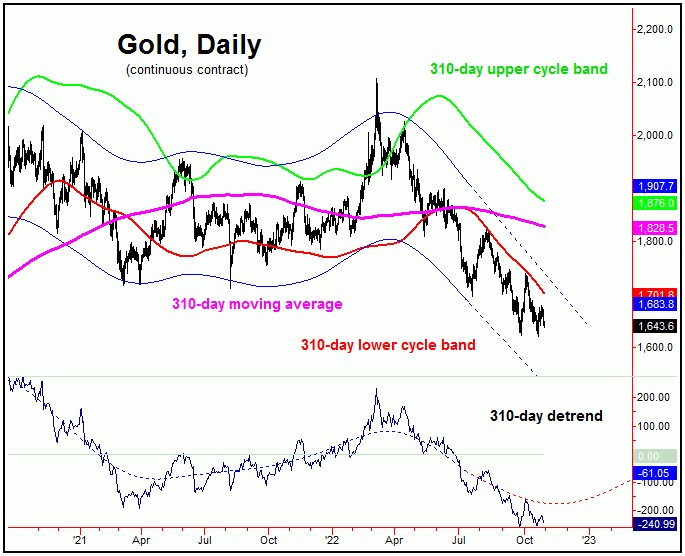
In terms of time, our 310-day detrend is looking for the next 310-day trough to form at anytime. The low for this wave should also end up as the bottom for the smaller 72-day component, and with that we are on the lookout for key technical signs these waves have seen their lows.
With the above, one of the things that we are looking at is our Gold sentiment/timing index, which is shown on the chart below:
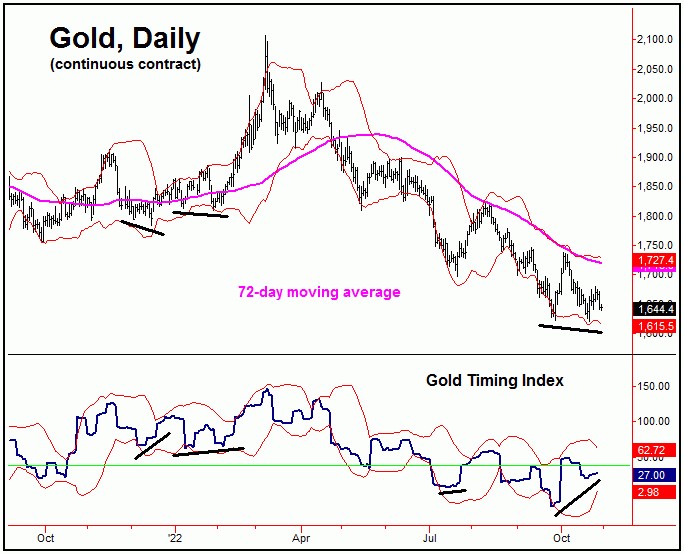
Our Gold sentiment/timing index is both a sentiment indicator - as well as a measure of market momentum. That is, at larger-degree lows the indicator will tend to register a divergence from price. Going further, we can see on this chart that this pattern was in fact seen at the October 21st low.
Having said the above, the noted divergence does not guarantee a key bottom has formed for Gold, just the potential that it could have been registered back on October 21st. With that, we are watching a key upside 'reversal point' for price, a number which - if taken out to the upside at any point going forward - would be our best trigger for the next larger-degree rally phase. Exact details are mentioned in our thrice- weekly Gold Wave Trader market report.
Gold's Bigger Picture
From whatever bottom that does form the 72 and 310-day waves, as mentioned in prior articles the probabilities will favor a sharp rally of some 20% or more playing out in the months to follow. At minimum, our 72-day moving average will act as the magnet to the next upward phase, though the ideal path is looking for the upward phase of the bigger 310-day cycle to make an eventual tag of its upper 310-day cycle band - which is obviously well above current price levels. Stay tuned.
Jim Curry
The Gold Wave Trader
http://goldwavetrader.com/
http://cyclewave.homestead.com/
********


