Gold Forecast: Gold Cycle Update


 Gold Market, Short-Term
For the near-term action, Gold managed to turn higher into Friday's session, with the metal hitting an intraday peak of 1729.50 - before backing slightly off the same into the daily/weekly close. With that, there is the potential for an upturn in the 10 and 20-day cycles, though that has yet to be confirmed.
For the very short-term, until proven otherwise, the downward phase of each of the 10, 20 and 34-day cycles is still deemed to be in force. The chart below once again shows our 20-day cycle in the Gold market:
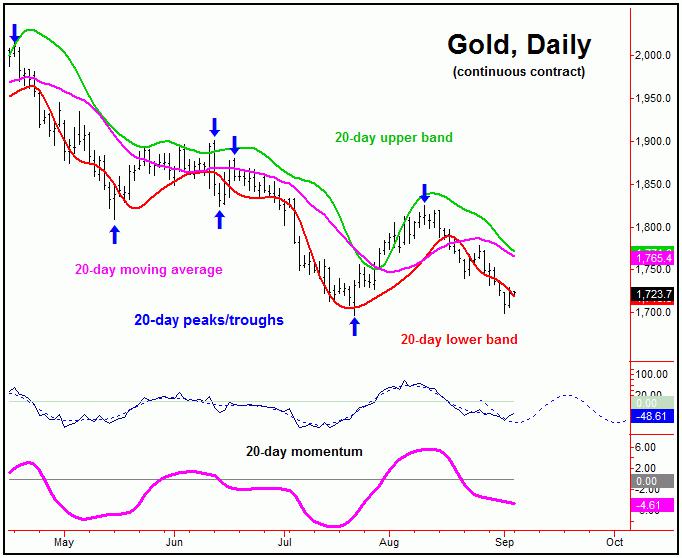
In terms of time, our 20-day cycle is now some 31 days along - and with that is moving into extended territory. The current downward phase of this cycle is looking set to bottom the larger 34-day wave, which is now into the early-end of bottoming range.
With the above said and noted, the ideal path is looking for a low anywhere in the current timeframe, to be followed by a rally into mid-September. Having said that, the recent action has decreased the probabilities for a push back above the 1824.60 swing top into mid-month, with the larger 72-day cycle - which is shown again below:
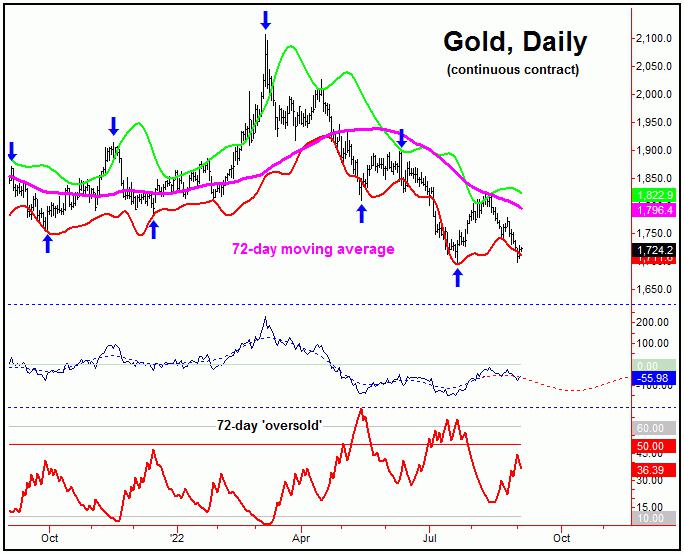
From the comments made in recent articles, our ideal path favored a rally into a mid- September high, before topping this larger 72-day wave. Having said that, as noted above, the strength of the most recent decline now greatly lowers the probabilities for a push back above the 1824.60 swing top in the coming weeks.
With the above said and noted, the probabilities tend to favor any short-term rally with the smaller 10, 20 and 34-day cycles to end up as countertrend, holding below the 1824.60 swing high. From a mid-September peak, another decline would be expected to play out into mid-October, where the next 72-day trough is projected.
Gold, Mid-Term
For the mid-term picture, the next bottom of significance is expected to come from the combination of 72, 154 and 310-day cycles - with the larger 310-day cycle shown on the chart below:
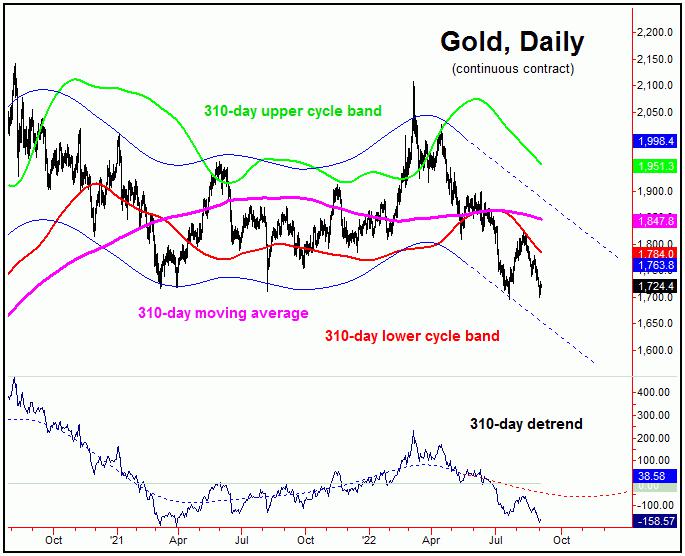
In terms of price, I have mentioned in past articles the potential for a spike down to the 1650 level or lower as this 310-day cycle bottoms, which is near the (extrapolated) lower 310-day cycle channel into early-to-mid October.
All said then, the suggestions are that a low in the current timeframe (10, 20 and 34-day cycles) should give way to what now looks to be countertrend rally into mid-September. From there, the downward phase of the larger 72-day cycle should assume control, taking the metal sharply lower into mid-October - then to be on the lookout for the next mid-term bottom to form.
For the bigger picture, from whatever low that is seen with the 72 and 310-day cycles going forward, the probabilities will favor a rally of some 20-25% or more off the bottom, which is the statistical average rally for this 310-day component. In terms of time, the overall assumption has been that an October, 2022 low would give way to a rally into what looks to be the Spring of next year (plus or minus). Stay tuned.
Jim Curry
The Gold Wave Trader
http://goldwavetrader.com/
http://cyclewave.homestead.com/
********


