Gold Forecast: Gold Cycles In Bottoming Range


 Last week's trading saw gold forming its low in Tuesday's session, here doing so with the tag of the 1750.10 figure. From there, a slingshot to the upside was seen into later in the week, with the metal pushing up to a Friday peak of 1795.90 - before backing off the same into the daily/weekly close. However, for the week as a whole, gold managed to end marginally higher.
Gold, Short-Term
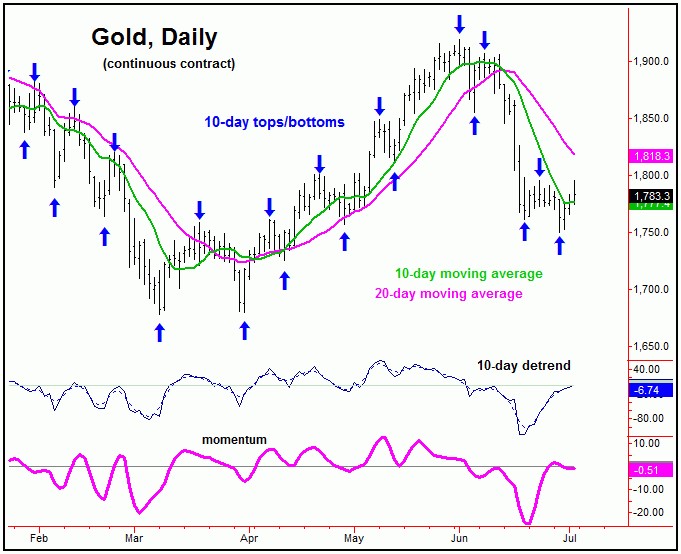
As mentioned last weekend, the last short-term rally came from the 10-day cycle in gold, which was noted as being in topping range. The rally phase of this component was favored to end up as a countertrend affair, which it was able to do - giving way to lower lows for the swing into last Tuesday. Here again is that 10-day wave:
Going further with the above, the most recent downward phase of the 10-day cycle has been the odds-on favorite to bottom the larger 20 and 34-day cycles, with the larger 34-day wave shown on the chart below:
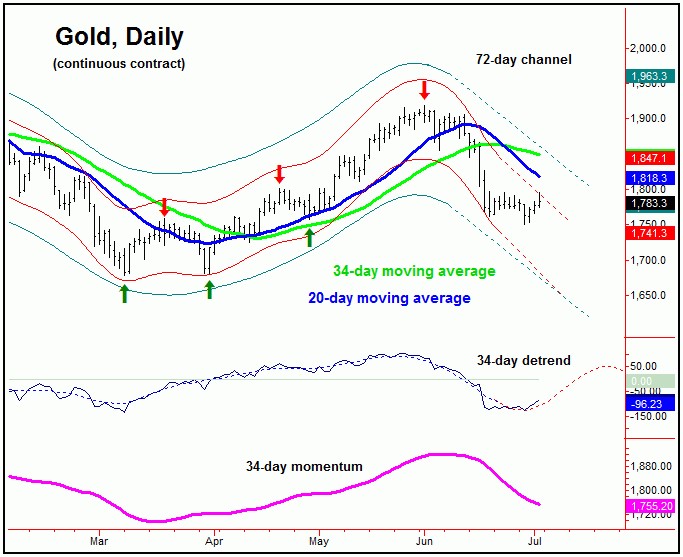
As mentioned in past weeks, the month of June was expected to bring a painful decline for the gold market, primarily due to the configuration of the above 34-day wave, and also due to the position of a larger (though less dominant) 72-day cycle.
With the above said and noted, there is a decent possibility that the 1750.10 swing low from last week will end up as our expected trough for the 34-day wave, though that has yet to actually be confirmed - by a key number that we are watching in our Gold Wave Trader report.
Once the next upward phase of the 34-day cycle is in force, a decent rally is expected to play out into later this month, once which sees the 34-day moving average acting as a normal magnet. This moving average is hit during approximately 85% of the upward (or downward) phases of this 34-day component.
Going further with the above, of note is that the 34-day moving average is also at or near the top of the extrapolated (and declining) 72-day cycle channel - thus making it a key resistance level for the near-term picture.
Take a look at the next chart:
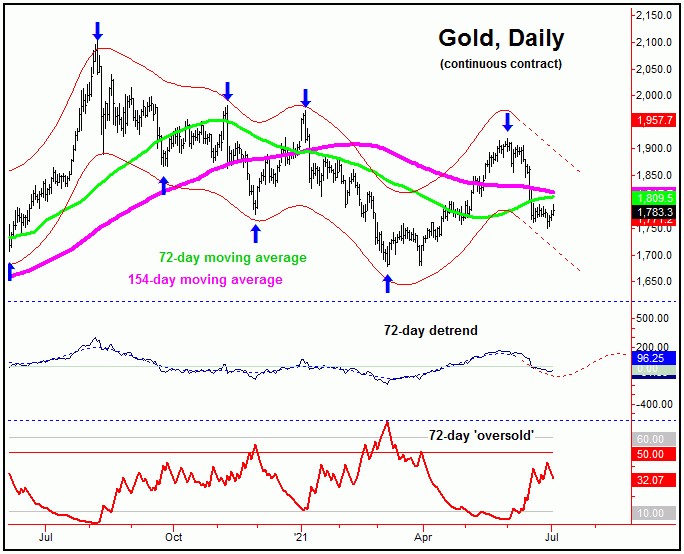
Since we are referencing the 72-day cycle in gold, the chart above shows that 72-day wave, which last bottomed back in March. At that time, I noted that our 72-day 'oversold' indicator was spiking above its upper reference line - which is something seen closer to lows with this particular component. This was also seen prior to the late-November, 2020 trough. Note that each of these spikes above the upper reference line were followed by rallies of several hundred points in the weeks that followed.
Going further with the above, I should point out that our 72-day 'oversold' indicator moves inverse to the price action for gold. That is, it tends to spike above its upper reference line at market bottoms, while drops below its lower reference line are seen closer to market peaks. The latter was another technical reason (in addition to other factors) that set the metal up for a sharp drop into June.
As for the current picture, our 72-day 'oversold' indicator has yet to actually push above its upper reference line, which has me at least a bit concerned. In other words, this may make the inference for a failed short-term rally with the smaller-degree waves in the coming days/weeks, before marking a more definable bottom.
Technical Signs
The chart below shows our Mid-Term Breadth index for the gold market, which turned to the downside in early-June, and with that was viewed as a technical negative, and seen as supportive of a good decline:
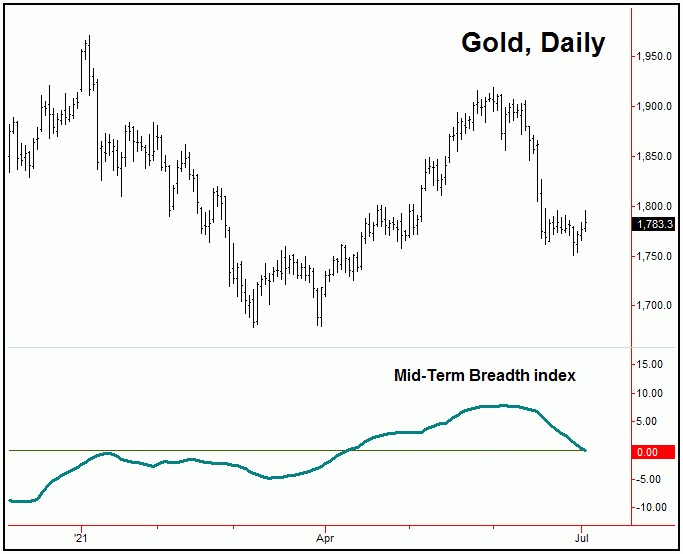
With the action seen in recent days, our Mid-Term Breadth index continues to push to the downside, and with that is viewed as a continued technical negative - at least for the shorter-term view.
Longer-Term Momentum, however, is still pointing higher, but is starting to flatten out:
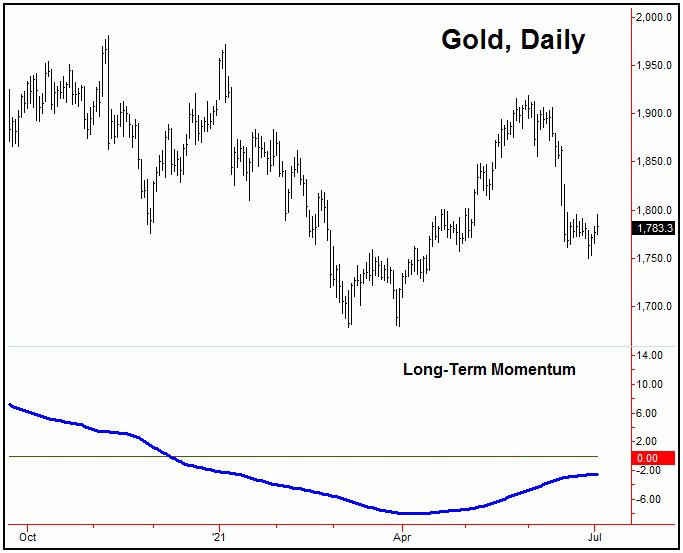
The action of our longer-term momentum indicator is of key importance in the coming days. In other words, should a turn south in this indicator be seen, then we will have to abandon the idea of buying smaller-degree lows - and will instead have to start looking to play the bearish side of the market. For now, however, it remains pointing higher, though we will be keeping a close eye on the same as we move along; stay tuned.
Jim Curry
The Gold Wave Trader
http://goldwavetrader.com/
http://cyclewave.homestead.com/
*********


