Gold Forecast: Gold Cycles Called the Bottom


 Recapping The Mid-Term Action
From the comments made in past months, the mid-term cyclical picture for the Gold market called for the rally into August to end up as a countertrend affair, before turning sharply lower into the mid-to-late October timeframe. In terms of price, a drop back to the 1650's or lower was the expected magnet to that decline.
In my last article (i.e., 'Gold Cycles Bottoming - Larger Rally Coming'), I mentioned that the metal was at or into the range for a mid-term low to form, with that low coming from the combination of 72 and 310-day cycles:
From 10/31/22 article: "our 34-day cycle is moving back into bottoming range, and is now set to trough the larger-degree 72 and 310-day cycles, from which a larger percentage rally is expected to unfold in the months ahead. As per the 72-day cycle's detrend projection, the metal is looking for a sharp rally in the coming months, coming as a result of the upward phase of this wave - as well as from the larger 310-day cycle."
As mentioned above, the low for our 72 and 310-day cycles was due to materialize around the mid-to-late October timeframe, but with a decent plus or minus variance in either direction - due to the size of the larger (310-day) component. The chart below shows the smaller of these waves, the 72-day cycle:
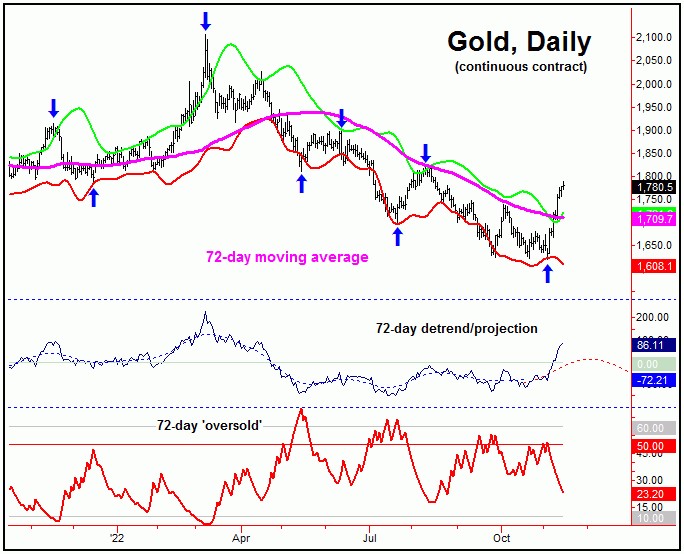
In terms of price, in our Gold Wave Trader market report, we noted the 1682.00 figure (December, 2022 contract) as the upside 'reversal point' for the 72 and 310-day waves. In other words, taking out that level (seen on 11/4/22) was our best indication these mid-term cycles had bottomed - and with that were looking for a sharp rally to unfold.
Some of the noted rally has been seen with the recent action, with Gold moving some 100 points on through our reversal figure, as the metal never really looked back - once taking out that 1682.00 number to the upside.
What's Next?
With the above said and noted, our 72-day cycle is deemed to be pushing higher into mid-December or later, before turning south for another correction into early next year. In terms of patterns, that decline would be anticipated to end up as countertrend, due to the configuration of the even-larger 310-day component - which is seen as pushing higher into next Spring. Here again is our 310-day cycle:
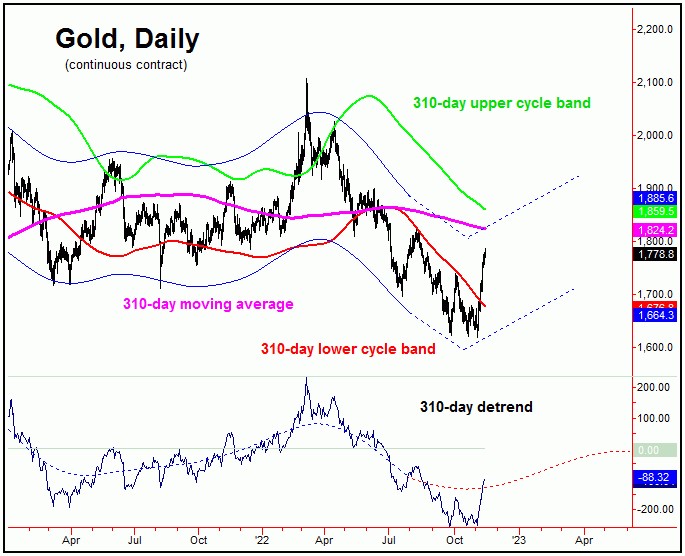
In terms of price, the ideal path for the mid-term is looking for additional strength in the coming months, with the upper 310-day cycle band acting as the eventual magnet. As mentioned in some of my past articles, the normal upward phases with this 310-day wave have seen rallies of 20% or more off the bottom, thus giving us some idea of how the action could play out going forward.
Adding to the notes above, Gold typically sees a very strong rally before the (confirmed) start to an economic recession, further supporting the idea of a mid-term rally phase currently in force for the metal.
Gold Market, Short-Term
Even with the above, there will be the normal short-term corrections along the way, the first of which is due to materialize, and coming from the 10-day cycle - which is shown again on the chart below:
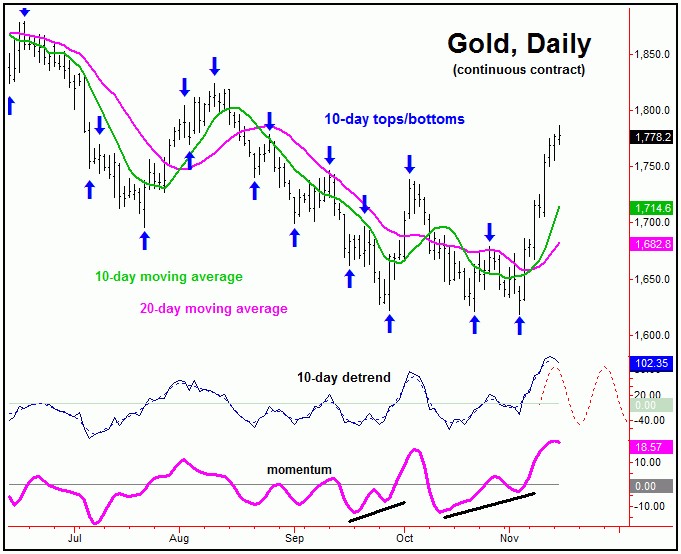
For the very near-term, the upward phase of our 10-day cycle is currently in force, with this wave now at 7-8 trading days along - and thus is looking for a quick correction off the top. In terms of price, the next correction phase of this cycle should see some try at the 10-day moving average or lower, a move which is anticipated to end up as countertrend - due to the position of the larger-degree waves.
In terms of time, the next trough for our 10-day cycle for Gold is due around the November 21st timeframe, plus or minus a day in either direction. In terms of price, it is too soon to confirm a new downside 'reversal point' for this wave, though one should ideally show up in the near-term - with the latest numbers always posted in our thrice-weekly Gold Wave Trader reports. Stay tuned.
Jim Curry
The Gold Wave Trader
http://goldwavetrader.com/
http://cyclewave.homestead.com/
*********


