Gold Forecast: Gold Cycles Called The Minor Top, What Next?


 Recap of Last week
Last week's action saw gold holding firm into early-week, with that action seeing the metal spiking all the way up to an Thursday overnight high of 1976.50 - coming on the heels of the Russia/Ukraine news. From there, however, a sharp decline was seen into the daily session, with the metal dropping down to a low of 1878.60 - before bouncing slightly off the same into Friday's close.
Gold, Short-Term Picture
From the comments made last weekend, the upward phasing of the 10 and 20-day cycles was still deemed to be in force, but were well into extended territory. With that, a sharp correction off the top was well overdue, simply due to the position of gold, in relation to its 10 and 20-day moving averages.
Here is the smaller of these cycles, the 10-day component:
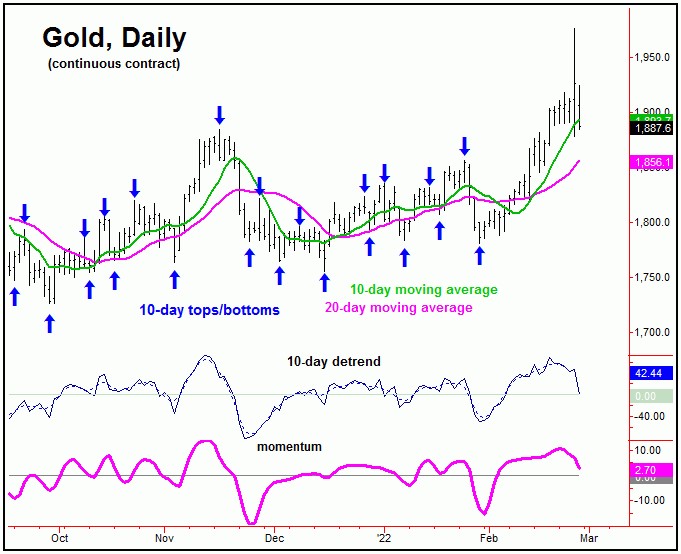
In terms of price, we use 'reversal points' to signal whether a particular cycle has made a turn - either to the upside, or the downside. The last low of significance came from the bottoming of the 10 and 20-day cycles, which came back on January 28th - a move which was favored to end up as a countertrend retracement.
It was the February 2nd reversal above the 1810.10 figure that confirmed the upward phase of these 10 and 20-day waves to be in force, with that upward phase taking gold all the way up to last Thursday's peak of 1976.50. A trader who followed that reversal, could have gained over 160 points from the confirmed reversal, to that high.
From last weekend: "With the current upward phase of this 10-day cycle making higher highs past the 10 trading day mark (now 15 days along), this puts this wave well into extended territory. We have found that an extended cycle has the above-average tendency to peak the wave of the next larger-degree. With that, the next short-term peak should not only top the 10-day wave, but should end up as the high for the larger 20-day component."
With the above said and noted, we were able to confirm the reversal to the downside for gold, which occurred in Thursday's session. With that, the ideal short-term path is looking for additional correction, though with Thursday's sharp drop already having met the minimum expectation of a drop back to the 10-day moving average. Having said that, the more ideal path looking for a drop on down to the lower 20-day moving average - which may also provide key support to the swing.
Gold's 3-6 Week View
Stepping back, we knew that the next key peak was due to materialize with the larger 72-day cycle, which is shown on the next chart:
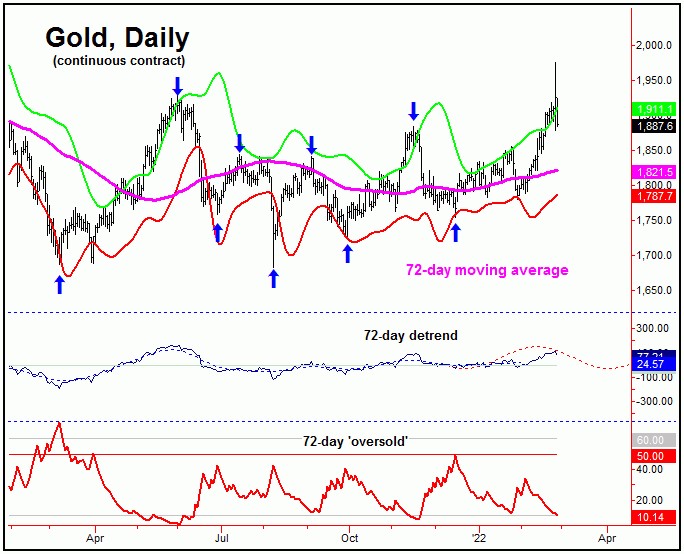
In terms of time, the upward phase of this 72-day wave was originally projected higher into the mid-January to mid-February region, where it was then looking to top - giving way to a decent decline into early-Spring.
With Thursday's sharp reversal to the downside, it is possible that the peak for this 72-day wave has now formed. However, that has yet to be confirmed, thus making the action key as we move into the new week, with the exact downside reversal point for this wave always posted in our Gold Wave Trader report.
As mentioned earlier, the 20-day moving average is both a magnet - and as key support for gold. That is, if the current short-term correction (10 and 20-day cycles) is able to remain on or around the same, then the metal could see a spike up to test the highs - or even make a new high for the larger swing - on the next short-term upward phase.
Otherwise, should a confirmed turn be seen in the days ahead, this action would favor additional decline back to the 72-day moving average and/or the lower 72-day cycle band, with the latter acting as a key mid-term support level. In terms of patterns, the next downward phase of this 72-day wave is favored to end up as countertrend, due to the configuration of the cycles above it.
Gold's Mid-Term View
In terms of time, our next 72-day low is projected for late-March to early-April. As noted, the patterns are looking for the downward phase of this wave to end up as a countertrend affair - due again to the position of the larger 154 and 310-day cycles, with the bigger 310-day wave shown on the next chart:
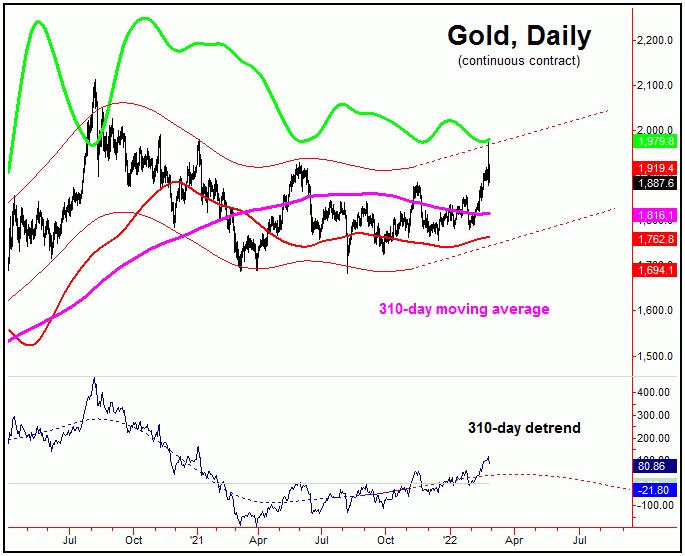
As mentioned in our Gold Wave Trader report, the 310-day cycle channel had recently turned back to the upside - thus inferring the August, 2021 low as the last bottom for this wave. With that, the overall assumption is that this cycle is currently heading higher into the Summer of this year, before turning south again into later in the year, where its next low would be due.
With the position of this 310-day cycle, a countertrend bottom with the 72-day wave into early-Spring should give way to another sharp rally into early-Summer, before looking for the next mid-term peak to form. That peak should come from this larger 310-day component, which should give way to a good decline into later this year. More on this as we continue to move forward in the cyclic configuration.
Jim Curry
The Gold Wave Trader
http://goldwavetrader.com/
http://cyclewave.homestead.com/
********


