Gold Forecast: Gold Cycles Moving into Bottoming Range


 From the comments made back in January, Gold was 'bracing' for its first correction of this year, with that correction expected to come from our 72-day time cycle, which is the most dominant cycle in the Gold market. That decline has played out on schedule, with the metal now moving into bottoming territory.
Gold's 72-Day Target Met
As mentioned above, the last correction of significance was due to materialize for Gold - coming from our 72-day time cycle, which is shown again on the chart below:
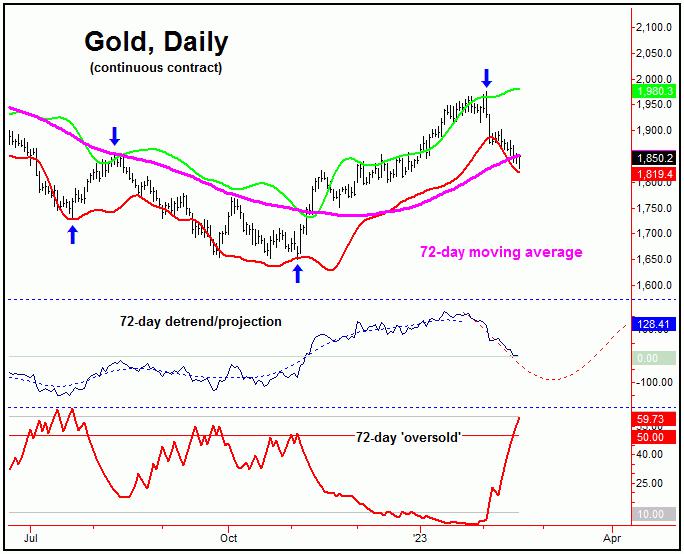
In terms of price, it was the February 3rd reversal below the 1912.60 figure (April, 2023 contract) which actually confirmed the downward phase of our 72-day wave to be back in force. Going further, following my rule that a cycle has the strong tendency to revert back to a moving average of the same length, the overall assessment called for a decline back to the 72-day moving average for Gold - an action which has now been satisfied with the decline into last week.
With the above said and noted, the next key low is expected to come from this 72-day cycle. In terms of time, the low for this wave - as projected by the detrend - is due around early-March, though with a decent plus or minus variance in either direction.
In terms of technical action, the one thing we have seen with the decline into last week was a spike above the upper reference line with our 72-day 'oversold' indicator (lowest pane, on our 72-day chart). This pattern is something we would expect to see at or near bottoms with this cycle.
Mid-Term Picture
In terms of patterns, the current decline with the 72-day cycle is favored to end up as a countertrend affair, inside the larger upward phase of our bigger 310-day component, which is shown on our next chart:
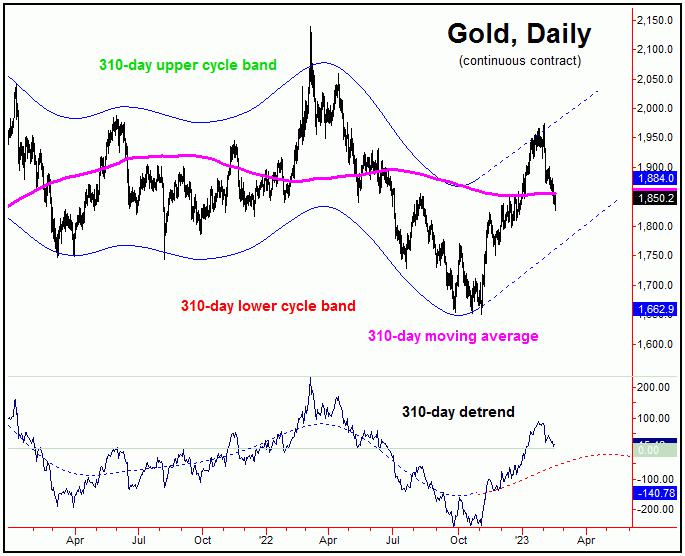
From the comments made in past months, our overall outlook called for a rally of 20% off the November, 2022 low - an assessment which was nearly met with the early- February peak of 1975.20. In terms of time, however, this 310-day wave is still seen as pushing higher into this Spring, before the next mid-term peak attempts to form.
As mentioned earlier, our ideal path is looking for the current correction phase with the 72-day cycle to end up as countertrend. If correct, its next upward phase should see a rally of some 14% or more off the bottom, which is its average rally for this cycle - when coming off the expected pattern of a 'higher-low'.
Going further with the above, in terms of time, the average rallies with the 72-day wave have lasted some 35-40 trading days or more before peaking, thus giving us at least some idea of what to expect - once this cycle does bottom.
The Bigger View
In terms of time, the bigger picture is looking for the next upward phase of the 72-day cycle - once it bottoms out - to see a sharp rally playing out into mid-to-late Spring of this year, before peaking our larger 310-day cycle. From there, we should see the largest percentage decline of 2023 for the Gold market, something in the range of 20% off of whatever top that forms with the 310-day wave.
With the above said and noted, we are now on the technical lookout for our next upside 'reversal point' with the 72-day wave. Once this number is taken out, it will be the trigger for the next rally phase with this cycle - with the latest numbers/analysis always posted in our thrice-weekly Gold Wave Trader report.
Jim Curry
The Gold Wave Trader
http://goldwavetrader.com/
http://cyclewave.homestead.com/
*******


