Gold Forecast: Gold Nearing Key Countertrend Low


 From the comments made in recent months, Gold's upward phase was favored to hold up into the mid-April timeframe, before turning south into a (countertrend) correction low, made into late-May to early-June. With the most recent decline in the metal, we are moving into the expected range for a key bottom to form.
Gold's 72-Day Cycle
As per some of my past articles, the last peak of significance was expected to come from our 72-day time cycle, which is currently the most dominant cycle in the Gold market.
Here again is that 72-day cycle:
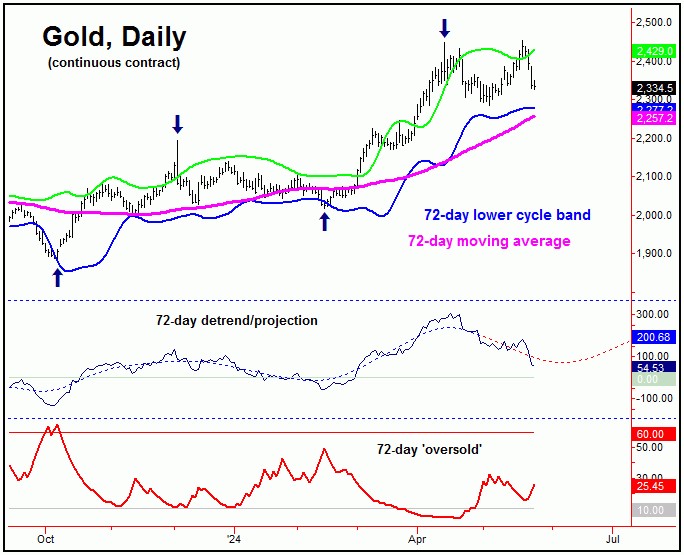
As pointed out back in March, the average rallies with this 72-day cycle - when coming off the expected pattern of a 'higher-low' - took around 39 trading days before completing. That action favored its most recent upward phase to remain intact until the April 9th timeframe or later, which was seen - with the metal spiking up to an April 12th peak of 2448.80 (June, 2024 contract).
In terms of price, Gold proceeded to drop to a May 3rd low of 2285.20 - a decline of 6.6% from the 2448.80 swing high, a normal low-end decline with this 72-day cycle. However, from there, the metal proceeded to rally back to a minor new high for the swing, doing so with the 2454.20 figure, made on May 20th.
Diverging Technicals at Recent Swing High
With the recent action, there is at least some potential that our 72-day bottomed out back in early-May. Having said that, the most recent spike high was not confirmed by technical action - as per our Gold Timing Index, shown on the chart below:
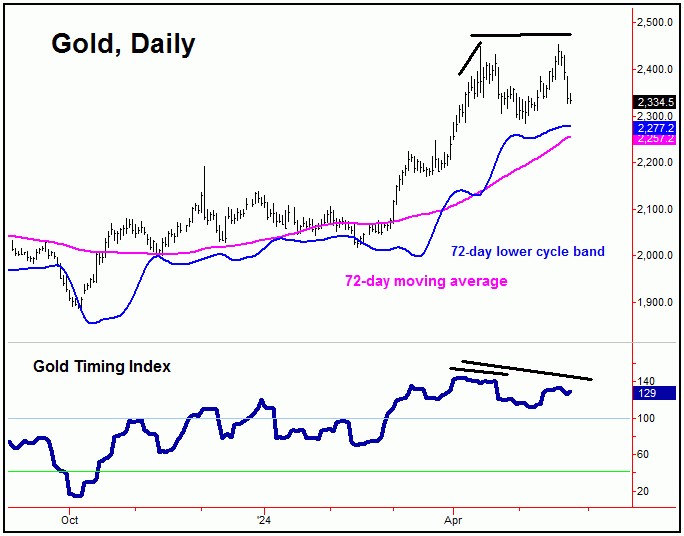
Our Gold Timing Index is our (proprietary) measure of momentum for the Gold market. That is, when price makes a higher high - and the indicator does not follow - a divergence is seen, and with that is viewed as a technical negative.
What normally follows is a sharp decline in price, in order to correct that divergence.
As mentioned in my last article, a divergence was seen between our Gold Timing Index and price at the April 12th spike high - which gave way to a 6.6% decline into early-May.
From there, however, a spike back to higher highs was seen into May 20th, though - as mentioned above - with our Timing Index having registered yet another divergence. With that, we pointed out (in our Gold Wave Trader report) the potential for another sharp correction, some of which has been seen with the decline into last week.
Price/Time Considerations
Going back to our 72-day cycle, in regards to price, we normally expect to see a drop back to the lower 72-day cycle band as this wave bottoms out - something that has been seen prior to 85-90% of the lows for this particular wave.
In terms of time, this 72-day cycle is still projecting a bottom in the coming weeks, and with that - until proven otherwise - we would like to see additional weakness playing out, then to be on the lookout for technical signs of a bottom forming with this component.
The above is key, as - following countertrend lows with this 72-day cycle - the following upward phases have seen rallies of some 10-14% or more. With that, we will be looking for indications to re-enter the long side going forward, based on the position of our 72-day cycle, as well as due to technical considerations.
The Big Picture for Gold
For the bigger picture, the larger upward phase has come from our bigger 310-day cycle - as well as the even-larger four-year wave - with the smaller 310-day component shown on the chart below:
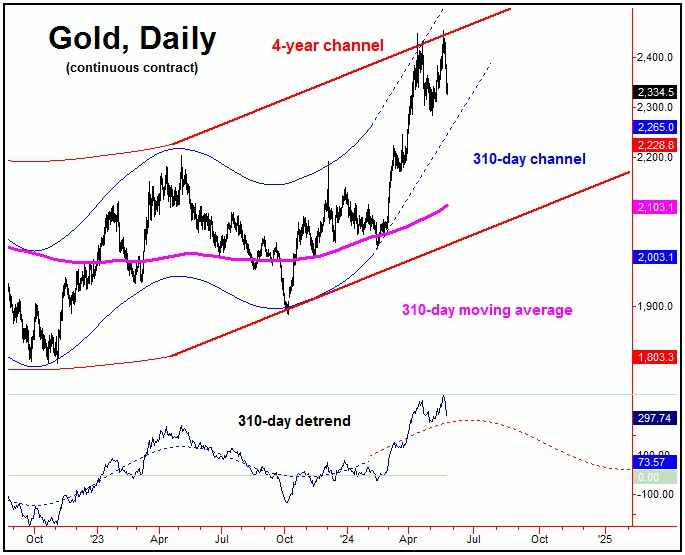
As mentioned back in the Autumn of last year, the last mid-term low was expected to come from this 310-day wave. In terms of price, the average rallies with this cycle were noted as having been some 20-25% off the bottom.
The upward phase of our 310-day cycle was confirmed to be back in force back in late- October of last year, thus indicating a 20-25% rally to be underway - and lasting into the Spring of this year. This was met with the strength into April/May.
Even said, with our detrend that tracks this wave looking for additional (time) strength, the overall assumption is that higher highs will be seen with this 310-day wave, upon the completion of the short-term correction, coming from the 72-day cycle.

The Four-Year Cycle in Gold
Above our 310-day wave, the largest-tracked cycle in Gold is the four-year component, which last bottomed back in October, 2022.
Here is that four-year wave:
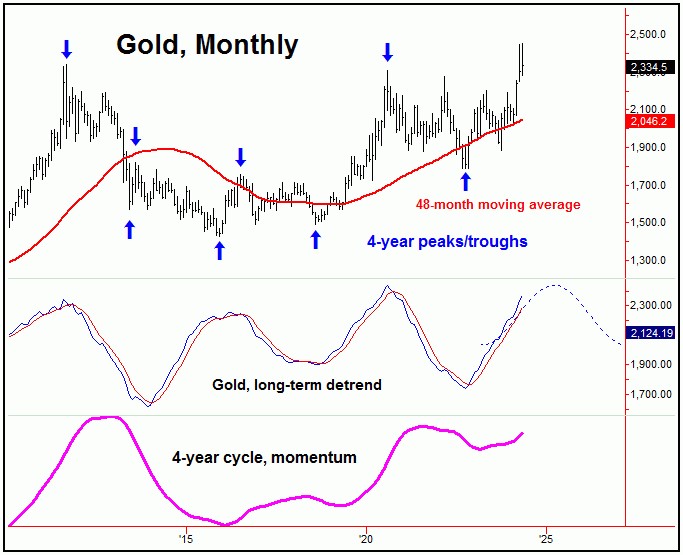
As can be seen on the above chart, our last four-year trough for Gold was made back in October, 2022. In terms of time, the upward phase of this wave is favored to remain intact until later next year, where it should peak again - giving way to another decline into what (tentatively) looks to be the late-2026 timeframe.
With the above said and noted, the overall positioning of the 310-day and four-year cycles tell us that Gold should remain in a larger bull market phase for at least the next year or more, though with the various corrections in-between, coming from the smaller-degree waves (such as the 72-day cycle).
In terms of price, we have recently confirmed an upside target with this four-year cycle in Gold, which gives us a precise level that we expect to reach going forward - with exact details of this target posted in our thrice-weekly Gold Wave Trader market report.
Jim Curry
The Gold Wave Trader
Market Turns Advisory
http://goldwavetrader.com/
http://cyclewave.homestead.com/
********


