Gold Forecast: Gold's Recent Rally. More to Come?


 Recapping The Action
Last week's trading saw Gold forming its low in Monday's session, here doing so with the tag of the 1778.00 figure. From there, a firm push higher was seen into later in the week, with the metal running up to a Friday peak of 1821.90 - also ending the day and week at or within earshot of the same. For the five-day period overall, the metal gained approximately 35 points.
Gold Market, Short-Term
As mentioned last weekend, the last short-term low was due to materialize for Gold, coming from our smallest-tracked wave, the 10-day wave, shown again below:
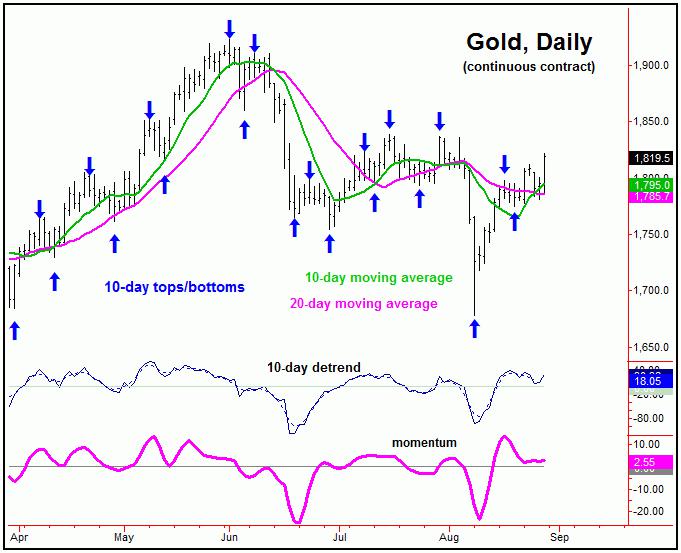
From last weekend: "the downward phase of the 10-day cycle is currently in force off the 1797.60 swing top, with this wave at some 9 trading days along - and with that looking for its next low to form again at anytime. In terms of price, however, the ideal path seems to favor additional retracement off the top, back to the 10-day moving average."
As mentioned last weekend, our 10-day cycle was at or into normal bottoming range, with that low later confirmed in place in our Gold Wave Trader outlook. From there, our call was for a rally up to the 1820-1830 region with the metal, due to the position of the next larger cycle that we track, the 20-day component:
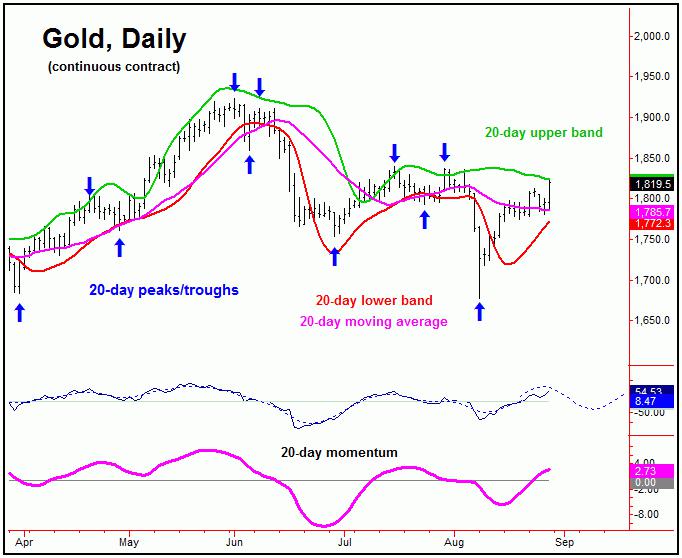
With the action seen into Friday's session, our expected upside price target has now been met for the 10 and 20-day cycles, though - due to momentum considerations - the probabilities seem do favor additional strength in the coming weeks, before the next peak of importance attempts to form.
For the very short-term, however, our 10-day cycle is now 6 trading days along, and with that is looking for another short-term top in the coming days. From that peak, the metal is likely to see another retracement back to the 10-day moving average, before giving way to higher highs for the swing on the next upward phase of this wave.
Gold's 4-8 Week View
Stepping back, as mentioned in prior articles, more key is whether the 1834.80 figure (December, 2021 contract) will be taken out on a closing basis - which is a key dividing line for our next wave, the 72-day component, shown below:
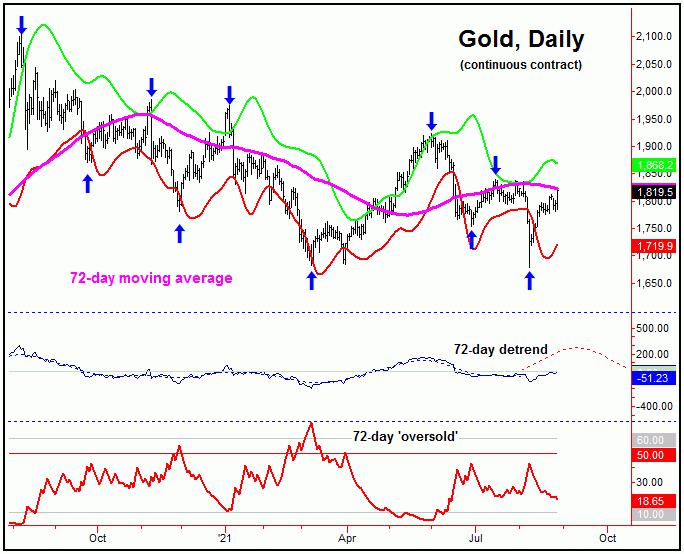
With the action seen in recent days, that upside 'reversal' number has now dropped slightly, to a daily close above the 1829.40 figure (December, 2021 contract) - and could continue to come down as we move along - with the latest numbers always posted in our Gold Wave Trader report.
With the above said and noted, any daily close above the 1829.40 figure - if seen at any point going forward - would tend to favor a 'momentum' upturn with the 72-day cycle. In turn, that action would favor additional strength on up to the 1860-1880 region - though the move would be favored to end up as a countertrend affair (i.e., holds below the June peak), due to the position of a larger 154-day cycle that we track.
The alternate, of course, is that 1829.40 holds the current rally on a daily close, and with that sees the larger downtrend making lower lows for the bigger swing into the October or November timeframe of this year, which is when the next trough for the aforementioned 154-day wave is projected:
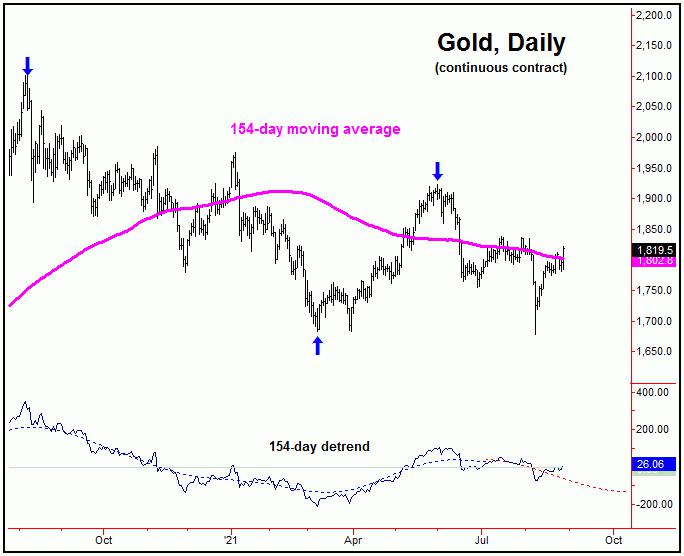
As mentioned in prior articles, taking out the June low of 1754.30 was our best confirmation of a turn south with this 154-day cycle, which, as noted, is projecting its next trough to occur around the October or November timeframe of this year.
With the above, the configuration of this 154-day wave should tells us to favor any smaller-degree rally phase - such as with the 72-day cycle - to end up as countertrend, ideally holding below the early-June peak of 1923.40.
If correct, lower lows would be expected to play out into the Autumn months, before a more key bottom occurs for the Gold market - with that bottom coming from this same 154-day component. From there, the next multi-month rally is likely to play out into the Spring of next year, before the next downward phase of a larger 310-day cycle that we also track starts to exert its dominance. Stay tuned.
Jim Curry
The Gold Wave Trader
http://goldwavetrader.com/
http://cyclewave.homestead.com/
********
More from Gold-Eagle


