Gold Forecast: 'Kill Zone' Sets Up Mid-Term Rally
 share
share
 share
share
 share
share
 share
share
 share
share
 With the recent action seen in the markets, I thought it would be a good time to take a look at both the Gold market - as well as U.S. stocks (as measured by the S&P 500) - with each of these markets nearing key junctures.
First, we will take a look at the U.S. stock market.
Near-Term Picture for U.S. Stocks
The last low of significance for the S&P 500 index (or 'SPX') was made back on 8/18/23, which came from our dominant 45-day cycle, shown on the chart below:
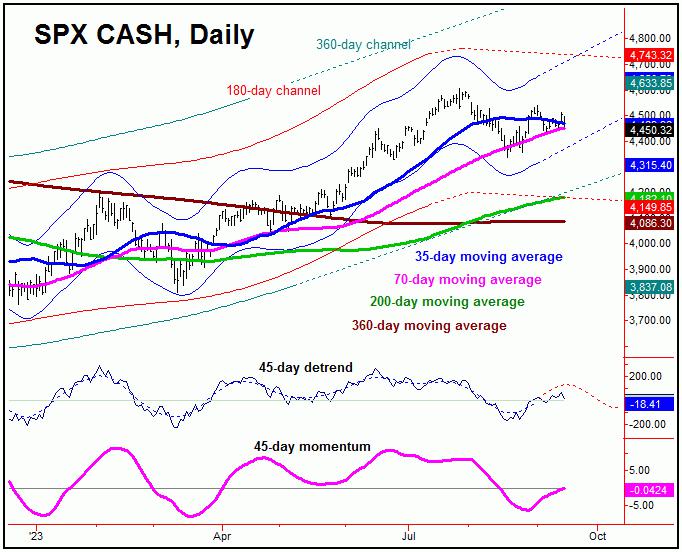
In our daily Market Turns report (which focuses on the U.S. stock market), our analysis called for a mid-term peak to form into the mid-to-late July timeframe, giving way to an initial low into mid-to-late August. That low came from - as mentioned - our 45-day cycle component, with its upward phase having been in force off the 4335.31 SPX CASH figure.
In terms of patterns, the upward phase of this 45-day cycle has been expected to end up as countertrend - holding below the 4607.07 swing top from July. In terms of time, the assessment favored the SPX holding up into mid-September, forming a potential Elliott wave 'B'. If correct, a final wave 'C' decline is expected to play out in the coming weeks, eventually giving way to the next mid-term low on the SPX.
In looking at the detrend that tracks our 45-day cycle, we can see that its next low is due into early-to-mid October. In terms of price, any reversal back below the 4356.28 SPX CASH figure would be the best indication that our 45-day cycle has peaked - and with that is heading south into that timeframe, which is also the anticipated bottoming range for a key mid-term cycle that we track.
The Mid-Term View
For the mid-term picture, the downward phase of our 180-day cycle is deemed to be in force off the late-July peak, ideally pushing south into October of this year.
Here is that 180-day wave on the SPX:
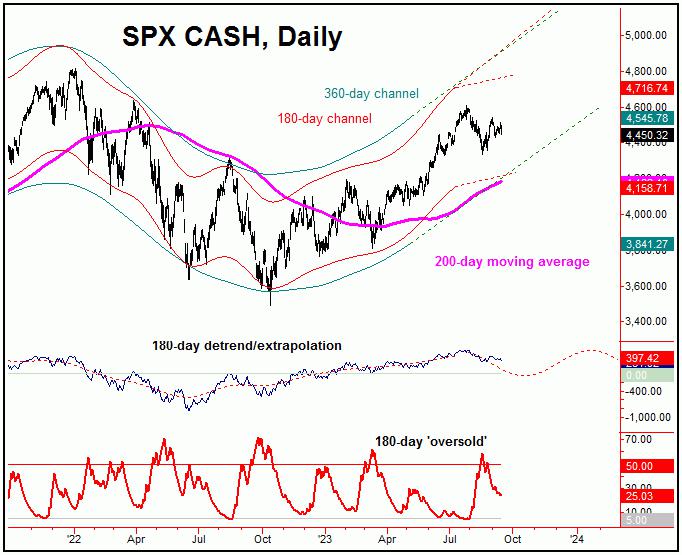
In terms of price, this decline into our next 180-day low has the potential to drop back to test the 200-day moving average on the SPX. If tested, this same moving average would also be a key support level to the larger bullish trend, which is coming from an even-larger 360-day component (more on this in a bit).
In terms of patterns, the downward phase of our 180-day wave is favored to end up as a countertrend, holding above the late-May low of 4048.28 SPX CASH. If correct, the next upward phase of this cycle should give way a sharp rally of some 17-23% off the bottom, as per the title of this article (i.e., the next mid-term rally).
Going further, the next upward phase of this 180-day cycle component should be the one that eventually tops the aforementioned 360-day wave, which is shown on our next chart:
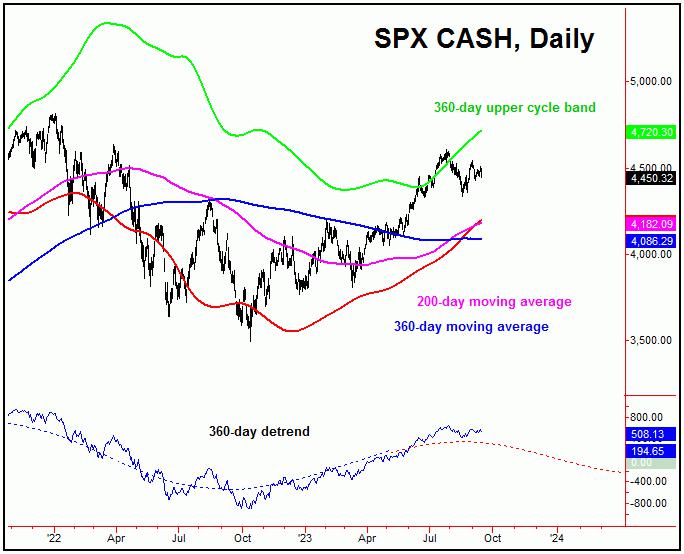
Once the next peak for this larger 360-day cycle forms (next year), its average corrections - when forming a 'higher-high' - have been 10-13% from peak-to-trough. Adding to this, the 360-day moving average - which is well below current price levels - would also act as the price magnet. This follows my rule that a cycle will revert back to a moving average of the same length, better than 85% of the time.
All said then, the SPX is looking for a key low to form in October, before seeing the second-best rally of this year playing out into year-end. On or some point after that, the next mid-term peak should form, coming again from our bigger 360-day cycle - which will be pushing down into late-Spring of next year. More precise details can be found in our Market Turns report, which focuses on the U.S. stock market.
A Look at the Gold Market
For the short-term picture for Gold, the downward phase of our 10 and 20-day cycles was recently deemed to be in force, with Friday's reversal above the 1938.60 figure (December, 2023 contract) confirming these waves to have bottomed.
Here is the larger 20-day cycle for Gold:
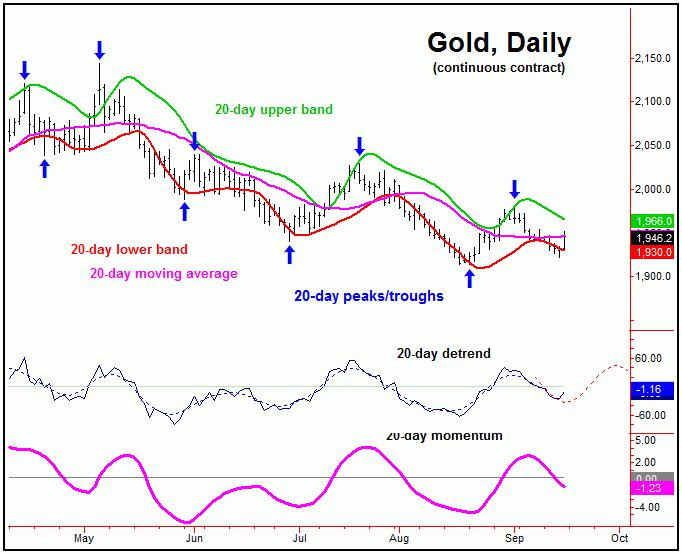
In terms of time, with the upward phase of our 20-day wave only one trading day along, we should see some additional upside with price in the coming days. There is even some potential for a push back to or above the 1980 swing top into later this month, before forming what is expected to be a countertrend peak for Gold.
Stepping back then, the rally with the 20-day cycle is expected to be a countertrend affair, holding below the 2029.20 swing top, seen back in July. From a late-September (or early-October) peak, the ideal path would be looking for another decline into October, where our larger 72-day wave is projected to trough:
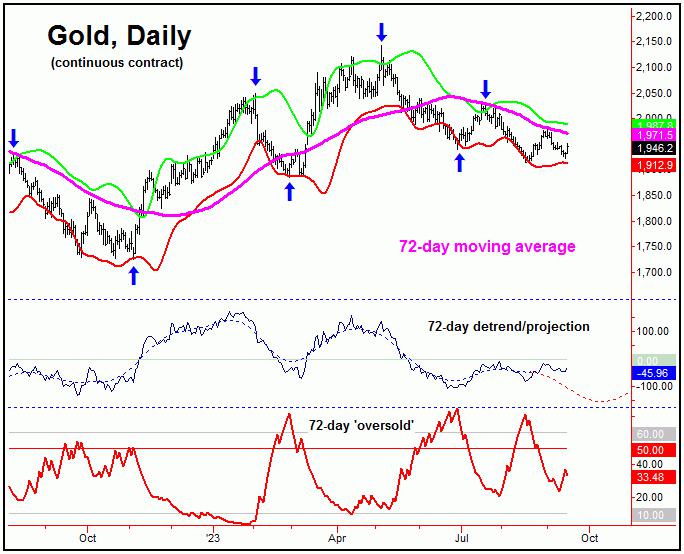
In terms of time, our last 72-day cycle top came well on the early side (left-translated), peaking with the late-July tag of the 2029.20 figure - thus making this a key dividing line going forward.
In terms of price, a drop below the 1913.60 swing bottom (registered in late-August) would be ideal as our 72-day wave next bottoms, a move which would be the technical setup for our next mid-term low for Gold, coming from our larger 310-day component, which is shown on our next chart:
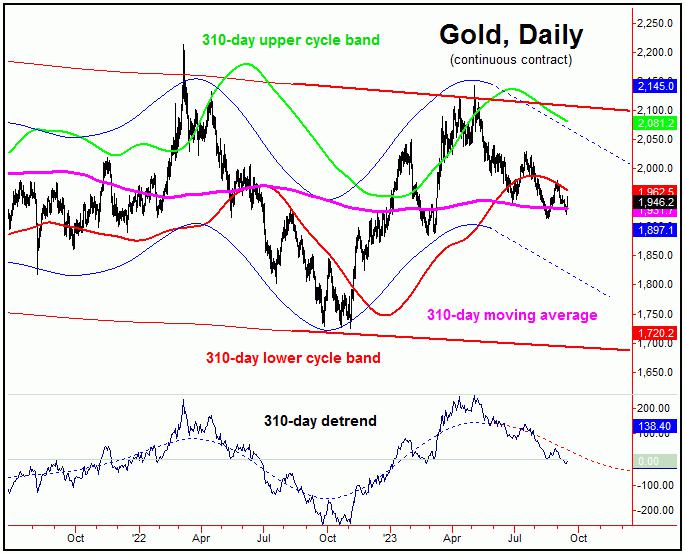
The last bottom for our 310-day cycle was seen back in November of 2022, forecast well in advance in our Gold Wave Trader market report. This bottom was later confirmed to be set in place, signaling a 20-25% rally in the months to follow - which played out precisely as forecast.
The downward phase of this 310-day wave is currently deemed to be in force, and with that - as suggested by our detrend that tracks this wave - is pushing south into the Autumn of this year. This low is not to be missed, as what follows should be another rally of some 20-25% or more in the Gold market, playing out into next year.
'Kill Zone' Sets up next Mid-Term Rally
With the above said and noted, there is a key date range (i.e., kill zone) of focus for Gold, for the next mid-term bottom to form. Precise details of this window - as well as the key price reversal point to the upside with our 310-day cycle - are noted and updated in our thrice-weekly Gold Wave Trader market report.
Jim Curry
The Gold Wave Trader
http://goldwavetrader.com/
http://cyclewave.homestead.com/
********
share
share
share
share
share


