Gold Forecast: Looking For Next Countertrend Low


 Recapping Last Week
Last week's action saw the Gold market pushing higher into Thursday's session, with the metal spiking all the way up to a peak of 1801.90. From there, however, a sharp decline was seen into Friday, here dropping back down to a low of 1765.10 - before bouncing slightly off the same into the daily/weekly close.
Gold's Mid-Term Picture
From the comments made in recent articles, the next key bottom for Gold has been expected to come from the combination of 72 and 154-day cycles, with the larger 154-day component shown again on the chart below:
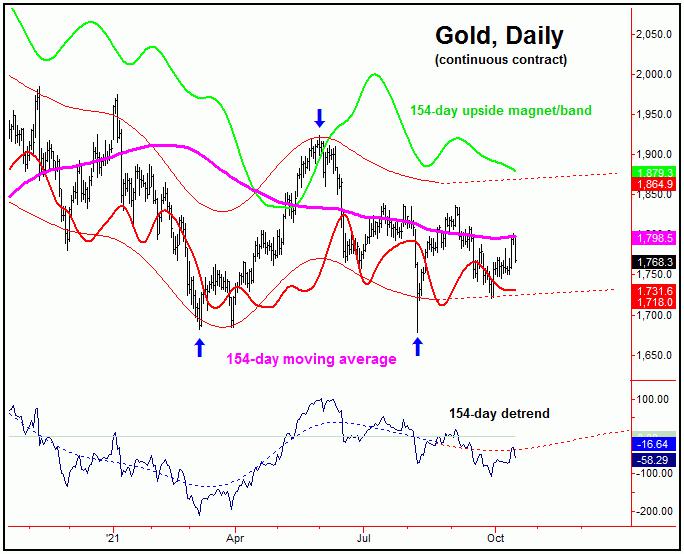
From last weekend: "In terms of time, our 72 and 154-day cycles have been projected lower into the late-October to early-November timeframe. In terms of price action, due to momentum considerations, the probabilities now lean in favor of the 1677 swing bottom to end up as the actual price low for this 154-day wave."
As mentioned in prior articles, the larger 72 and 154-day cycles were looking for a combination low to form sometime around the late-October to early-November window, a range which we are now at or into.
Having said the above, due to momentum considerations, the action seen into last week now favors the upward phase of the 72 and 154-day cycles to be back in force. In terms of patterns, the last 72-day trough had to have formed a 'higher-low' - against the August bottom. Here again is that smaller 72-day wave:
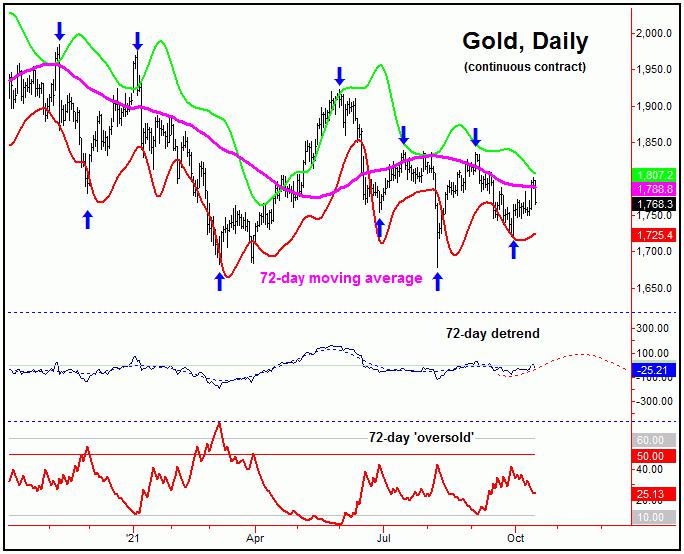
With the above said and noted, the fact that this 72-day cycle formed a 'higher-low' on its most recent correct tends to favor the 1836.90 swing top (i.e., the last peak for this component) to eventually be taken out on its current upward phase. In terms of time, this 72-day wave - via our cycle detrend indicator - is now projecting strength into the mid-November timeframe or later.
Gold's Short-Term View
As mentioned in recent weeks, the last short-term upward phase had resistance around the 1785-1800 level (December, 2021 contract), and with that looked to have peaked at the 10/8/21 swing top. Having said that, that action was never actually confirmed, and with that the metal managed to spike back to a higher high for the swing into last week - but stalled again into the upper-end of resistance.
In our Gold Wave Trader report, we noted that the next short-term correction phase was expected to come from the combination of 10 and 20-day cycles, with the 10 and 20-day moving averages acting as the approximate downside price magnets. Here is the larger of these two waves, the 20-day component:
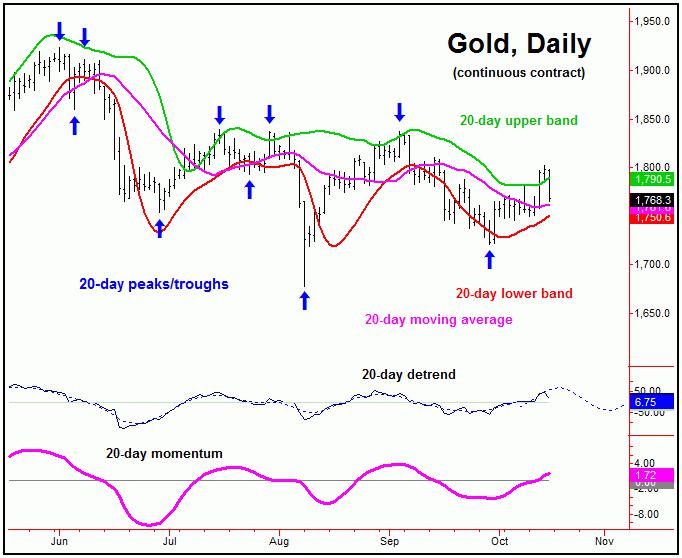
With the action seen into Friday's session, it looks like the downward phase of the 10 and 20-day cycles is now back in force, with the decline already meeting the minimum expectation of a tag of the 10-day moving average - and with the 20-day moving average not too far below current price levels.
Adding to the notes above, with the larger 72 and 154-day cycles now favored to be pointing higher into November or later, the probabilities tend to favor the current smaller-degree correction to end up as a countertrend affair, holding above the 1721.10 swing low. Support to the same looks to be into the 1740-1760 area, thus making this range a key level to watch in the coming days.
Stepping back then, a countertrend correction with the 10 and 20-day cycles - if seen as expected - should give way to higher highs on the next swing up into mid-November or later, with the ideal path looking for a push back above the 1836.90 swing top, though with the potential for that move to eventually reach up to the upper 154-day cycle band (i.e., 1870's or better).
For the bigger picture, until proven otherwise, the current upward phase of the 154-day wave is currently favored to end up as a countertrend affair, holding below the June peak of 1923. If correct, then the next downward phase of this wave should take the metal down again into the Summer of next year, for a larger combination bottom with both the 154 and 310-day waves. More on this as we continue to move forward.
Jim Curry
The Gold Wave Trader
http://goldwavetrader.com/
http://cyclewave.homestead.com/
********


