Gold Forecast: Market 'Panic Zone' Drawing Near


 Recapping Last week
Last week's trading saw Gold forming its low in Monday's session, here doing so with the tag of the 1892.20 figure. From there, a gradual uptrend was seen into late-week, with the metal pushing all the way up to a Friday high of 1974.90 - also ending the week at or near the same.
Gold, Short-Term Picture
For the very short-term, the prior correction took Gold back down to its 10-day moving average - which also acted as support to that decline. Here again is the smallest- tracked wave for the Gold market, the 10-day cycle:
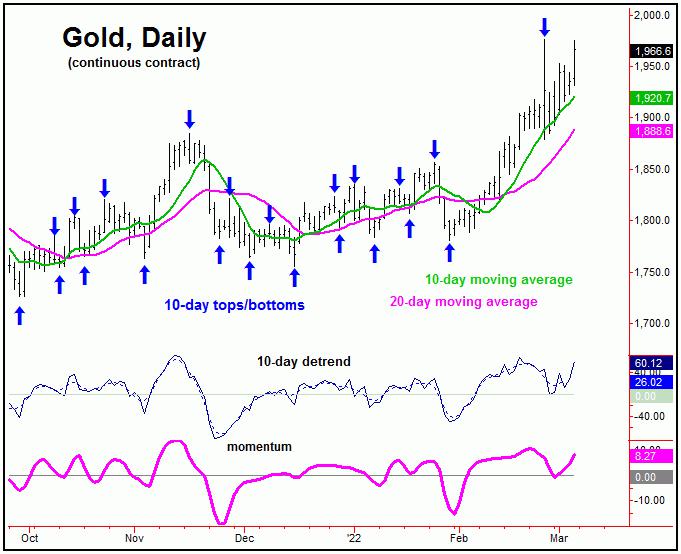
Having said the above, due to the statistical fact that a cycle (here, the larger 20-day wave) will revert back to a moving average of the same length better than 85% of the time, the ideal path favored a drop on down to the lower 20-day moving average - which was not seen, or which has yet to materialize.
With the above said and noted, should Gold take out the 1976.50 swing top, then we will have to label a 10 and 20-day trough in place, though there would still be the risk for a quick spike down to the 20-day moving average. That same moving average looks to be a key support level, should it be attempted at any point in the days ahead.
Gold's Stepped-Back View
Stepping back, the next key peak is due to materialize with the larger 72-day cycle, which is shown on the next chart:
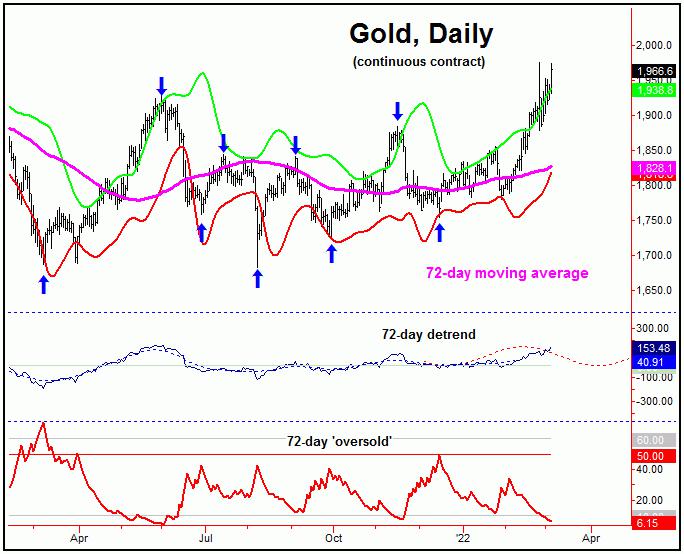
From the comments made in past articles, the last trough for this 72-day cycle was made back in mid-December, with its current upward phase having been projected higher into the mid-January to mid-February timeframe. Thus, with Gold still making higher highs here into early-March, the upward phase of this 72-day component is starting to move into extended territory.
Also mentioned in prior articles, the peak for our 72-day cycle was never confirmed to be set in place, which offered up the potential for higher highs before topping the same. In terms of price, our downside 'reversal point' for this wave has recently moved up, now to a daily close below the 1874.00 figure (April, 2022 contract). This number could/should continue to rise going forward, depending on the action.
With the above said and noted, any daily close below the 1874.00 figure - if seen at any point going forward - would tell us our 72-day wave has topped, and with that to be headed south into the late-March to early-April timeframe, where it is next projected to trough. Until proven otherwise, that move down is anticipated to end up as a countertrend affair, giving way to higher highs in the months to follow.
Market 'Panic Zone' Looms Close
In terms of time, there is a key range of interest, which is what I am referring to as a short-term 'panic zone' for world markets. That date range is set for March 16-21 of this year, and which is just a few weeks away. This date encompasses the next fed date of March 16th, and is also a key bottoming range for several cycles that track the U.S. stock market. One of the main cycles is shown below, the 45-day wave:
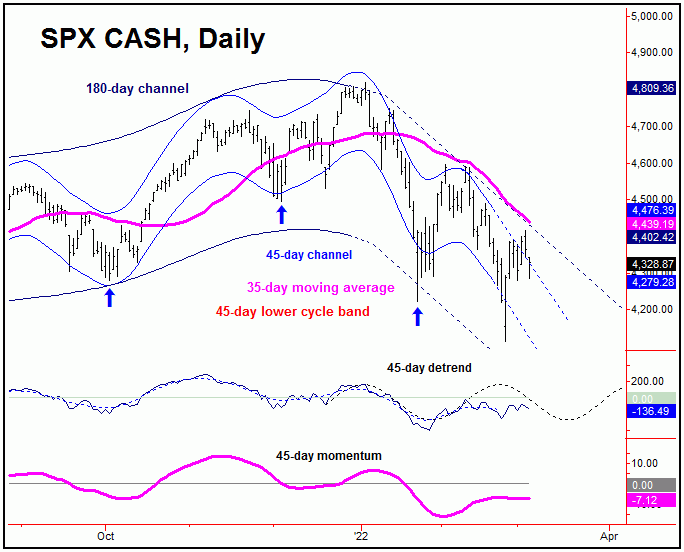
From the comments made in our Market Turns reports (which track the U.S. stock market), the last 45-day top was made at the early-February high of 4595.31 SPX CASH, with its downward phase later confirmed to be in force, with the same projecting a low around mid-to-late March.
The next low for this 45-day cycle in U.S. stocks should also end up as the expected bottom for the larger 90-day wave, which is shown on the following chart:
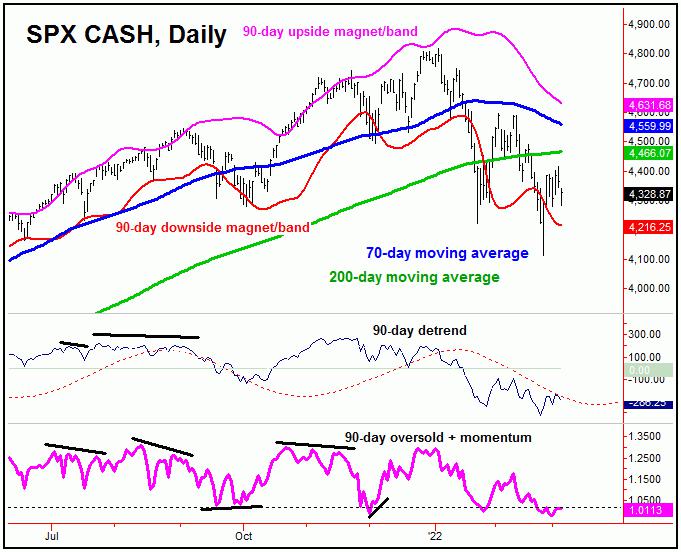
Once the next low is in place for the 45 and 90-day cycles, the SPX should see a minimum rally back to the 35-day moving average into April, though with a push on up to the 70-day moving average being more ideal.
In terms of price, the average rallies with the 45-day cycle - when forming the pattern of a ‘lower-low’ - have been in the range of 9-14% from trough-to-peak, with the upward phases of the larger 90-day wave having been around 17%. With that, a mid-to-late March bottom for these waves - if seen - should give way to a sharp rally of some 9-17% off the bottom into what looks to be the month of May.
In terms of price, there is key support at or into the 4000-4050 SPX CASH region, which encompasses both daily 'swing support' (i.e., 4047, plus or minus), as well as the 100% extension of the move down from the 4818.62 swing top to the 4222.62 initial swing low (around the 4000 figure). This range - if tested on a technical contraction - seems to be the early odds-on favorite to bottom the larger correction phase. More on the bigger picture assessment for U.S. stocks as we move forward.
Jim Curry
The Gold Wave Trader
http://goldwavetrader.com/
http://cyclewave.homestead.com/
********


