Gold Forecast: New Year, Old Gold? The Devil Is in the Patterns


 Changes are expected with the advent of a new year, but the precious metals seem to have missed the moment of transition. When will they wake up?
The year 2021 is over, 2022 has finally arrived. However, why does the current price action look “sooo last year”? Because the patterns appear to be repeating and the clearest similarity is present in the key precious metal – gold itself.
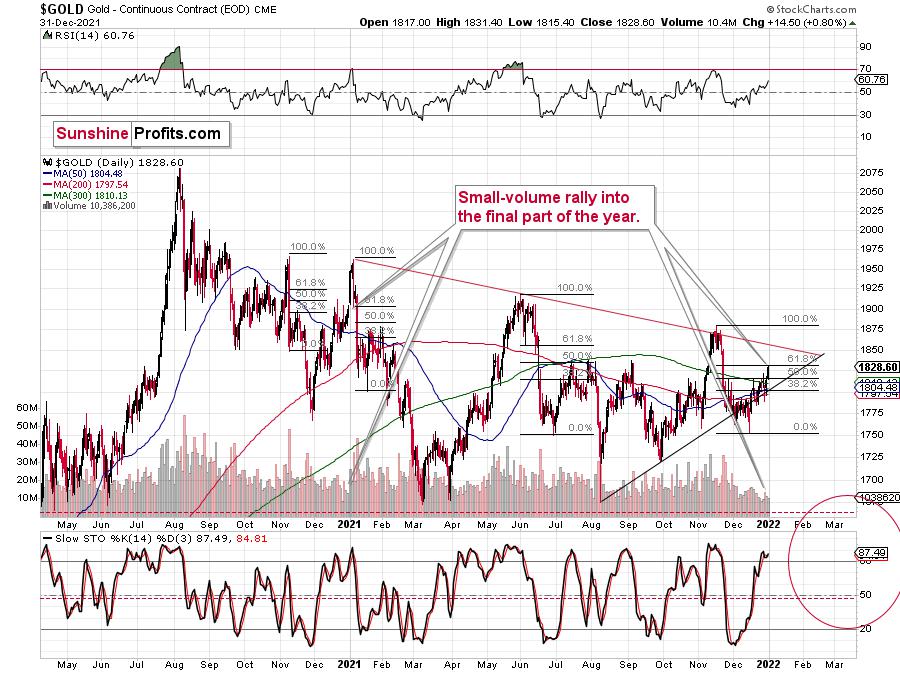
Gold prices moved higher in late December, and it happened on low volume. The rally caused the stochastic indicator to move above 80 and the RSI above 50. That’s exactly what happened in both: late 2021 and late 2020.
What does it mean? Well, it means that we shouldn’t trust this rally, as it could end abruptly, just like the one that we saw a year ago.
Besides, gold corrected 61.8% of the preceding decline (so it moved to its most classic Fibonacci retracement), which means that – technically – what we saw in the past two weeks was just a correction, not the beginning of a new rally.
Moving back to the similarity to what happened last year, let’s take a look at the mining stocks’ performance.
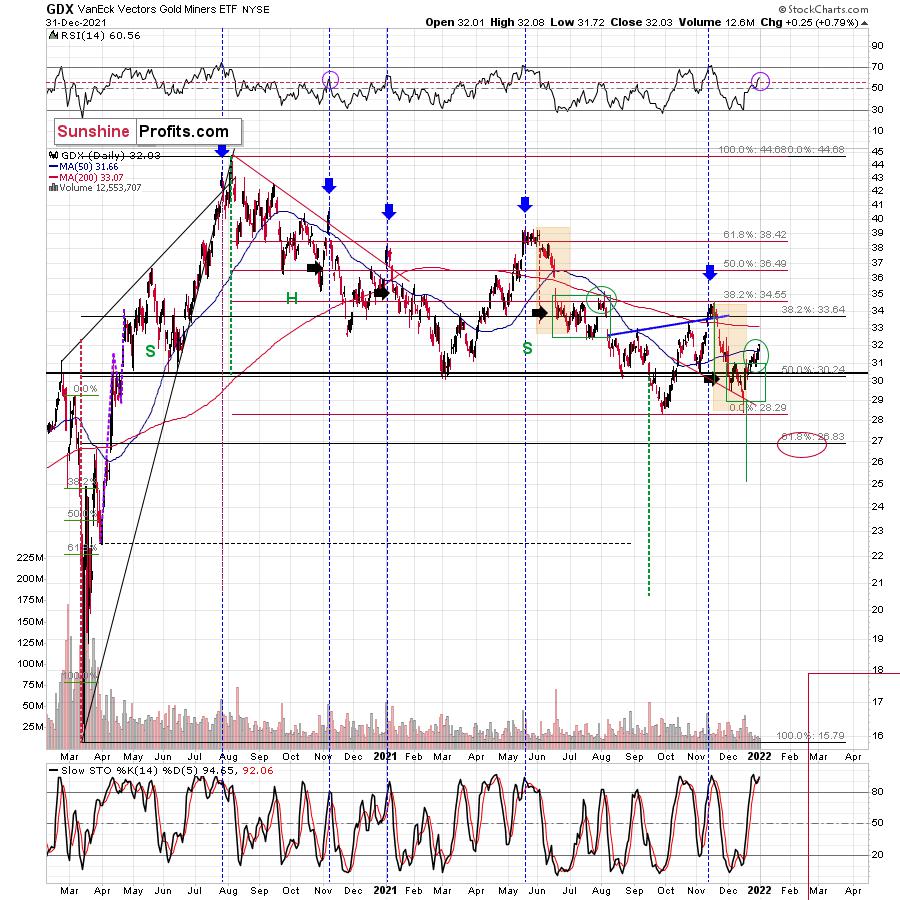
The price moves were more volatile last year, which is why it’s useful to look at the analogies from the indicators’ point of view. After all, indicators exist to make situations more comparable to each other and, thus, to be able to play the history-rhymes card more often.
The stochastic indicator is above 80, and the RSI is above 70. I marked the moves in the RSI with purple ellipses – they look alike.
Since declines followed soon in January 2021, it seems that we’re going to see something similar also this year.
Of course, the analogy to last January is not the most important one. What happened in 2013, 2008, and 2000 is much more important. In particular, the link between now and 2008 is interesting because of what’s happening in the stochastic indicator in the long-term HUI Index chart.
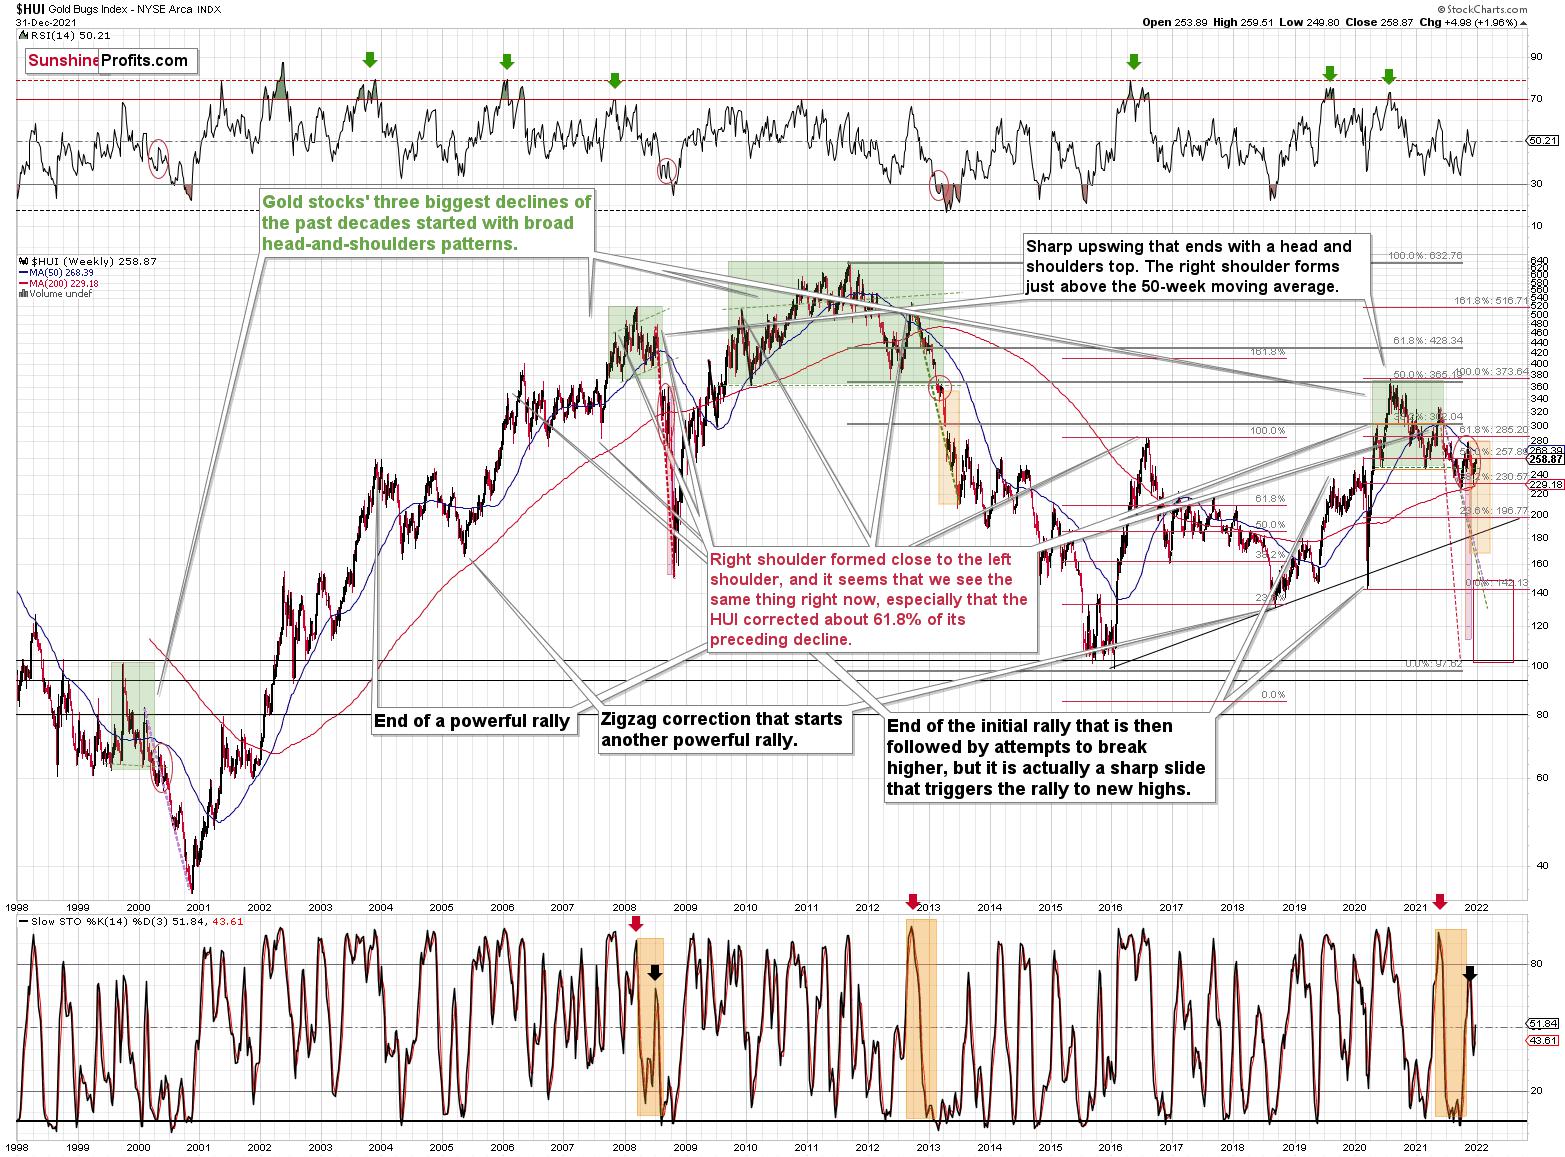
The moves in the indicator are similar, and I marked the specific tops with red and black arrows. In the current situation, we saw yet another small move up, but that’s most likely because the price moves are now less volatile. The areas marked with red ellipses remain similar and show back-and-forth movement before the big decline.
We are now in this back-and-forth trading movement period.
The implications are not bullish, but bearish.
Speaking of back-and-forth movement, let’s take a look at what’s been taking place in the USD Index recently.
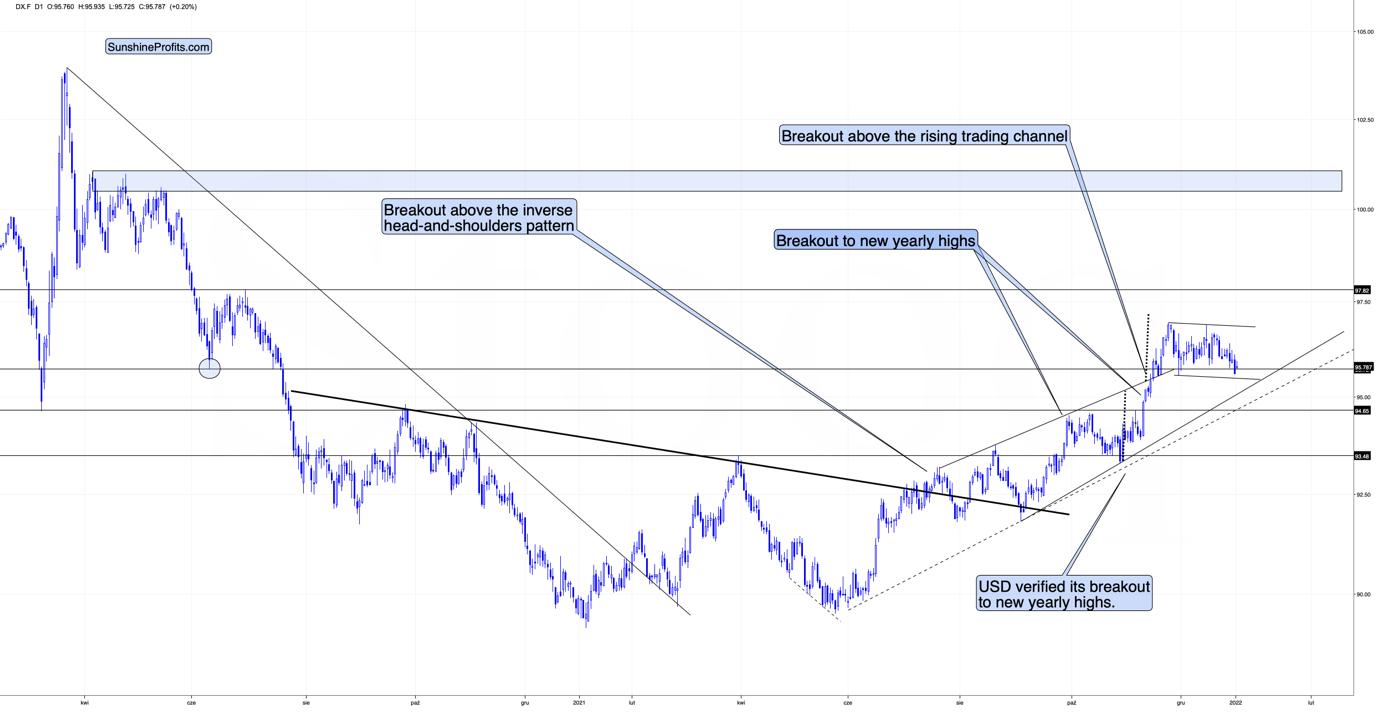
The USDX has been consolidating after rallying sharply in November 2021. This is quite normal, and we saw something similar after previous short-term rallies during the current medium-term rally.
By the way, do you remember when I told you how the USD Index was likely to rally in 2021, when everyone and their brother was bearish on it last year?
The July-September 2021 consolidation, as well as the smaller October consolidation, were also normal parts of the bigger upswing. However, why would I say that this is a consolidation and not a double top?
Because the consolidation takes place after the USD Index breaks clearly above the previous important lows. The March 2020 low and the June 2020 low can be examples. Consolidation has been taking place above the latter. In fact, it was even tested in late November, and it held. The recent move lower is simply another test – just like what we saw in June 2020.
Since consolidation has been taking place for some time now, it’s likely that the next move higher will be quite visible once again.
This means that the previous target of about 97.5 might have been too conservative. Instead, it seems more likely that the USD Index would rally to its previous resistance area close to its April and May 2020 highs. That’s approximately the 100-101 area.
Of course, such a rally in the USD Index would be bearish for precious metals prices.
Let’s take a look at the silver price outlook.
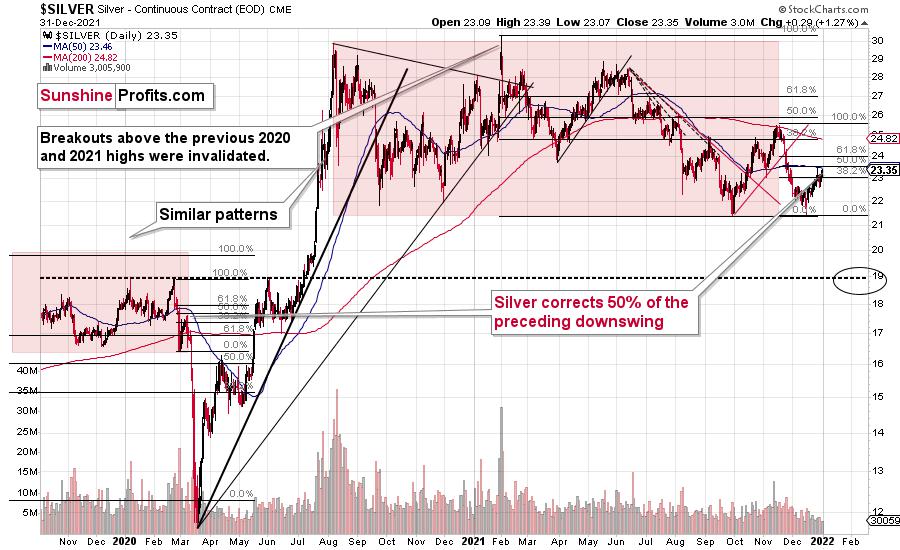
The white metal is not as strong as it was in late 2020 and early 2021, but it seems to be repeating a different pattern.
Namely, after the late-Feb. and early-Mar. 2020 slide (that took silver to its previous lows), silver corrected about half of its previous decline. The same thing happened recently.
Back then, silver topped close to its 50-day moving average, and that’s where the white metal moved recently as well.
Just because this pattern is similar price-wise, it doesn’t mean that it’s identical time-wise, and thus that silver is likely to drop as quickly as it did in 2020. Right now, the price moves are not as volatile, and the declines are unlikely to be AS volatile as they were in 2020 – at least not before the final part of the decline.
It seems that what took days in 2020, now takes weeks. This means that we might see a decline that’s so huge that it takes weeks or even months to complete, not just several days.
Summary
To summarize, the outlook for the precious metals sector remains extremely bearish for the next few months. Since it seems that the PMs are starting another short-term move lower more than it seems that they are continuing their bigger decline, I think that junior miners would be likely to (at least initially) decline more than silver.
From the medium-term point of view, the key two long-term factors remain the analogy to 2013 in gold and the broad head and shoulders pattern in the HUI Index. They both suggest much lower prices ahead.
Thank you for reading our free analysis today. Please note that it is just a small fraction of today’s all-encompassing Gold & Silver Trading Alert. The latter includes multiple premium details such as the outline of our trading strategy as gold moves lower.
If you’d like to read those premium details, we have good news for you. As soon as you sign up for our free gold newsletter, you’ll get a free 7-day no-obligation trial access to our premium Gold & Silver Trading Alerts. It’s really free – sign up today.
Przemyslaw Radomski, CFA
Founder, Editor-in-chief
Sunshine Profits - Effective Investments through Diligence and Care
* * * * *
All essays, research and information found above represent analyses and opinions of Przemyslaw Radomski, CFA and Sunshine Profits' associates only. As such, it may prove wrong and be subject to change without notice. Opinions and analyses are based on data available to authors of respective essays at the time of writing. Although the information provided above is based on careful research and sources that are deemed to be accurate, Przemyslaw Radomski, CFA and his associates do not guarantee the accuracy or thoroughness of the data or information reported. The opinions published above are neither an offer nor a recommendation to purchase or sell any securities. Mr. Radomski is not a Registered Securities Advisor. By reading Przemyslaw Radomski's, CFA reports you fully agree that he will not be held responsible or liable for any decisions you make regarding any information provided in these reports. Investing, trading and speculation in any financial markets may involve high risk of loss. Przemyslaw Radomski, CFA, Sunshine Profits' employees and affiliates as well as members of their families may have a short or long position in any securities, including those mentioned in any of the reports or essays, and may make additional purchases and/or sales of those securities without notice.
********
 Przemyslaw Radomski, CFA, is the founder, owner and the main editor of SunshineProfits.com. You can reach Przemyslaw at: http://www.sunshineprofits.com/help/contact-us/.


