Gold Forecast: The Pause That Refreshes For Gold


Last week's trading saw gold forming its high in early-week trading, here doing so with the tag of the 2024.60 figure. From there, a decline was seen into early-Friday, with the metal dropping down to a low of 1916.60 - before bouncing off the same into the daily/weekly close.
Gold's Mid-Term Picture
From the comments made in recent weeks, gold was set for a series of corrections, though with the mid-term view expected to remain bullish into at least later this year. At that point, the metal will be due for its next larger price peak - which is expected to be followed by a sizeable decline into next year. That peak-and-decline phase will come from the 310-day time cycle, shown again on the chart below:
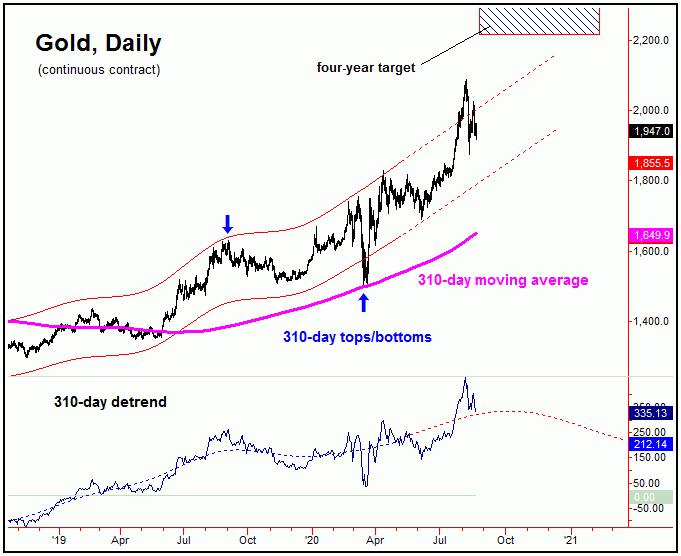
From the comments made in past articles, we expect this 310-day cycle to remain pointing higher into later this year. In terms of price, there is an open upside target with this wave to the 2212.00 - 2340.56 region (December, 2020 contract) for gold. As mentioned before, these targets are very reliable, with 85% of the cycle targets given in past years having been met.
With the above said and noted, the 310-day target range gives us the potential upside, upon completion of the current correction. The shorter-term decline is coming as a result of the smaller 34-day wave, which is shown on the next chart:
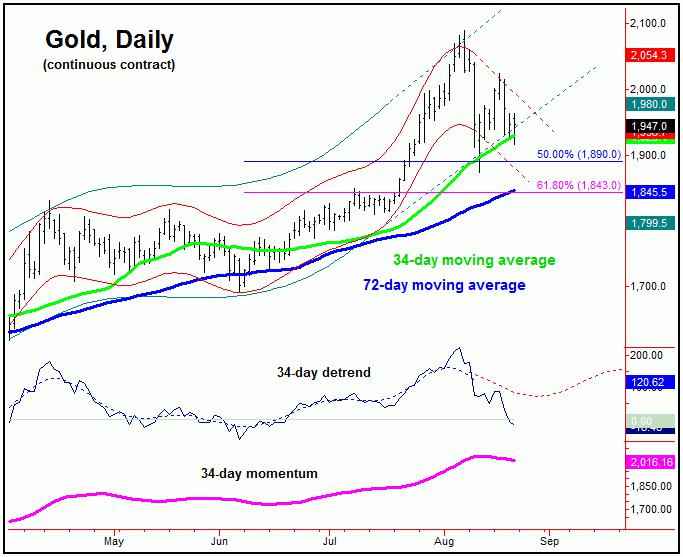
The chart above shows the 34-day cycle in gold, which topped back in early-August with the tag of the 2089.20 figure. There were technical divergences seen well prior to this peak, which ended up with the eventual and sharp correction phase that followed, with the metal pushing down to a recent low of 1874.20.
In terms of time, the detrend that tracks our 34-day wave is deemed to be pushing lower into later this month - which would be an ideal spot for the next buy signal to develop. From there, we would be looking for a continuance of the larger uptrend into later this year, once again with the aforementioned 310-day target zone in mind.
The Bigger Picture Assessment
For the bigger picture then, the next peak of real importance should come from the aforementioned 310-day cycle, made later this year. From whatever high that does form with this component, a fairly sharp correction phase is expected to play out into the Spring of 2021, with more precise details noted in our Gold Wave Trader market report.
Suffice to say, the next decline phase from the 310-day cycle will be the largest percentage drop in gold prices since the decline into the August, 2018 bottom - though the move should, ultimately, end up as a countertrend affair. If correct, higher highs should continue to play out on the next upward phase of this wave, due to the configuration of the larger four-year cycle, shown below:
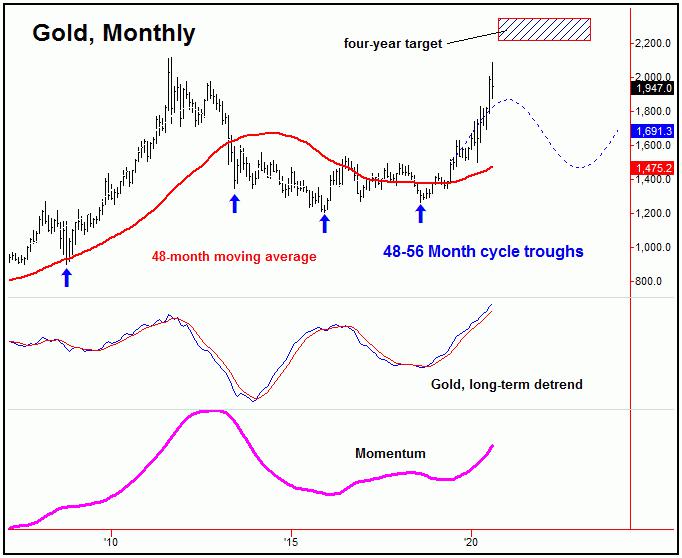
The next trough for our four-year wave is projected for the year 2023, plus or minus. With that, a countertrend decline with the 310-day cycle into the Spring of 2021, if seen as expected, should give way to another higher high in price - before turning south into 2023, where our four-year bottom is due.
Gold, Short-Term
For the near-term picture, the last short-term low came from our smallest-tracked wave, the 10-day component, which is shown below:
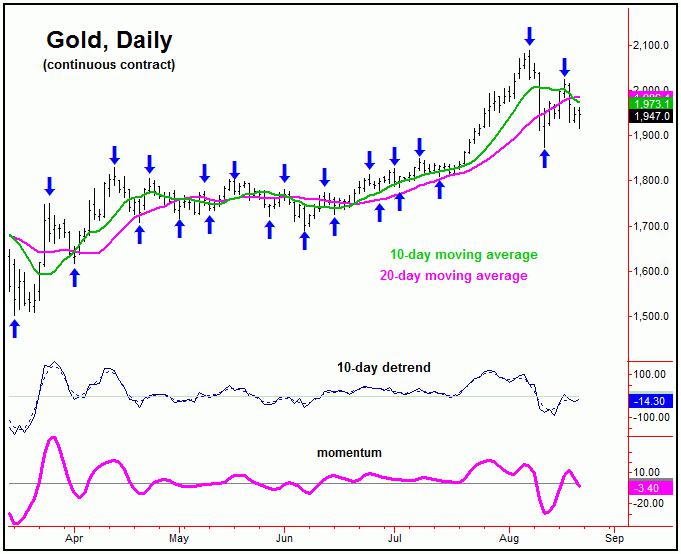
From last weekend: "our 10-day wave looks like it bottomed in Wednesday's session, even though we have yet to actually confirm the same. If correct, however, the ideal path for the near-term would favor a bounce back to the 10-day moving average, a move which would be favored to end up as a countertrend affair - giving way to a push back to or below the lows again in to later this month."
As mentioned above, the short-term path favored a rally back to the 10-day moving average - due to the strong tendency for a cycle to revert back to moving average of the same length. We did get that with the rally seen into early last week, though prices fell back from the same into later in the week, with that decline coming from this same 10-day component. With that, another minor cycle bottom is due with this wave, which may have been registered on Friday, though it has yet to be confirmed.
Technical Indications
From the comments made in prior articles, our Mid-Term Breadth index started to diverge from price back in late-July - several weeks ahead of the actual price top. Here is a chart of this indicator:
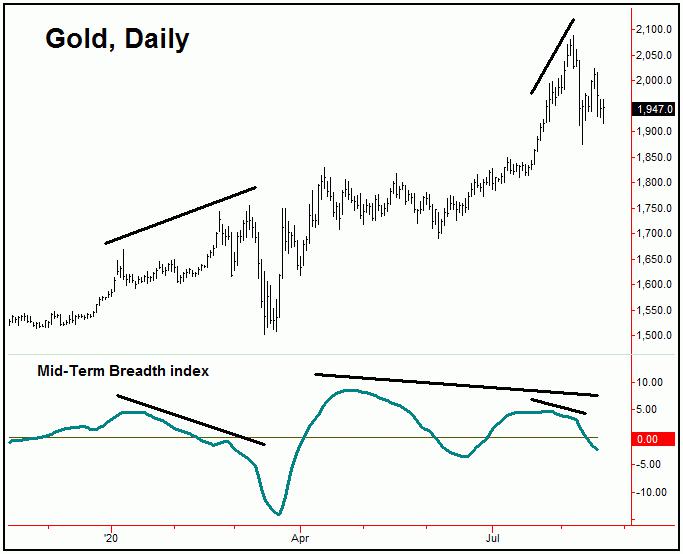
With the above said and noted, the position of our Mid-Term Breadth index warned that a sharp decline was coming, as the last such divergence - seen back in January/February of this year - also warned. With that, the decline seen off the 2089.20 swing top was not a huge surprise - though the short-term 'blow-off' into the early-August peak took prices higher than suspected.
Adding to the notes above, our Mid-Term Breadth index is still pushing lower, and with that is still viewed as at least a near-term bearish indication in regards to technical action. Having said that, this indicator nearly always turns after key market bottoms, and with that we will want to keep an eye on it in the days/weeks ahead - with the next good move up expected to take prices into the 2212.00 - 2340.56 target zone into later this year. Stay tuned.
Jim Curry
The Gold Wave Trader
http://goldwavetrader.com/
http://cyclewave.homestead.com/


