Gold Forecast: Predicted Gold Rally Has More to Run


 Recapping Last week
Last week's trading saw Gold forming its low in Tuesday's session, here doing so with the tag of the 1727.00 figure. From there, a sharp rally was seen into late-week, with the metal pushing all the way up to a Friday peak of 1784.60 - also ending the week at or near the same. Note: We move to the December, 2022 contract for our numbers.
Gold's Short-Term View
As pointed out in recent articles, Gold was looking for a key short-term low to form, with that low coming from the 10, 20 and 34-day cycles. As noted last weekend, that bottomed looked to have formed - and with that suggested that a very sharp rally was in store for Gold. The chart below shows our 34-day time cycle:
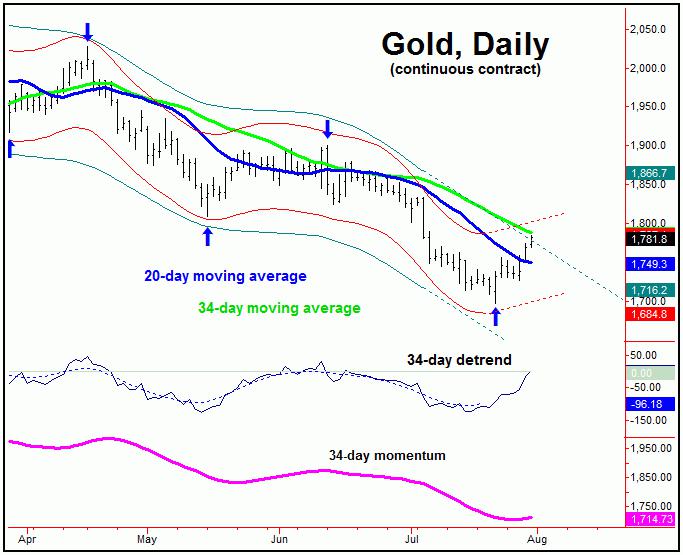
From last weekend: "the probabilities now tend to favor this short-term combination low to be set in place. Going further, that action suggests the potential for a sharp rally in the coming weeks, with the 34-day moving average or better acting as the ideal magnet."
As mentioned above, the minimum upside potential for the metal was back to the 34-day moving average for Gold - which has nearly been met with the action seen into Friday's session.
If the move is going to end up as an immediate failure, then it would do so at or near this same 34-day average - which is also near the upper (and declining) 72-day cycle channel. From there, a drop back to or below the lows would be possible into the mid-to-late August timeframe, before bottoming the larger 72-day cycle:
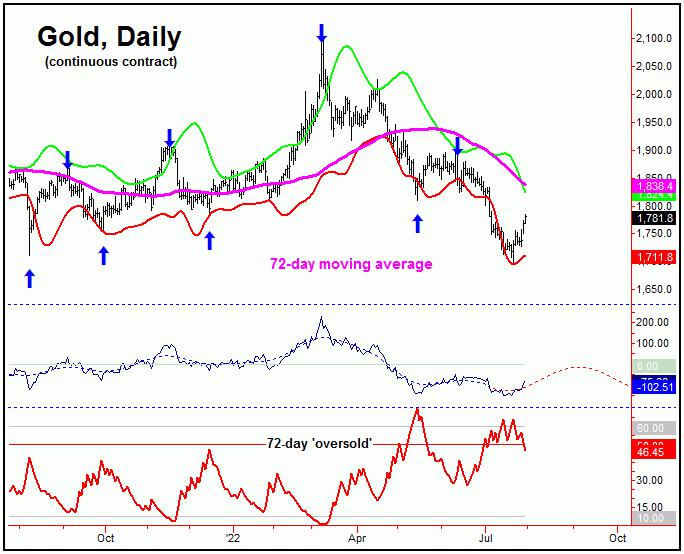
From last weekend: "there is one alternate that I am considering - and a strong case can actually be made for the same. That is, the most recent low was not only a bottom for the 10, 20 and 34-day cycles, but will also end up as a contracted trough for our larger 72-day wave. If this were to end up as correct, then the current rally would have the potential to rise as high as the 72-day moving average, and/or the upper 72-day cycle band - each of which are well over 100 points above current price levels. In other words, there is the potential for a huge amount of upside for Gold, at least for the short-term."
The alternate path noted last weekend has moved to the preferred scenario going forward. In other words, our larger 72-day cycle looks to have seen a contracted low at the July 21st bottom - and with that is headed on higher in the near-term, with the 72-day upper cycle band acting as the magnet.
There were several factors supporting a contracted low with the 72-day wave, with the first being our 72-day detrend, which had been projecting a shortened (contracted) time trough for this particular cycle.
Going further with the above, at the July 21st low our 72-day 'oversold' indicator (which moves inverse to price) was already back above its upper reference line, along with price being below the lower 72-day cycle band. This setup is normally seen near key bottoms with this 72-day component.
Gold's Mid-Term View
For the mid-term picture, however, the overall assumption is that the rally phase of the 72-day cycle will end up as a countertrend affair, giving way to lower lows into mid-to-late October of this year or later. This again is due to the current position of the larger 310-day cycle, shown again on the chart below:
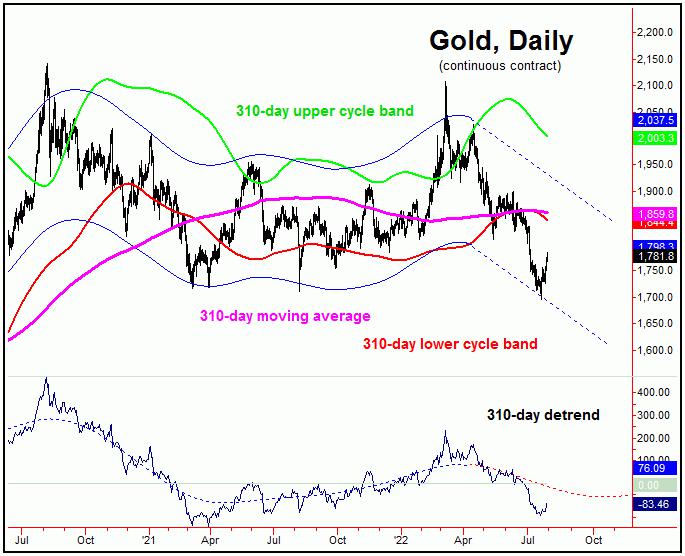
The upward phase of this 72-day wave is projected to end up as countertrend - holding below the June peak of 1900.50 - the last labeled top for this particular cycle. If correct, the next downward phase of that cycle would be favored to give way to lower lows for the larger swing into mid-October or later.
Going further with the above, the mid-October timeframe is when the next trough is projected with our larger 310-day component, with the potential for Gold to push down to the 1650's or below as this bigger wave attempts to trough. From there, we will need to be on the lookout for key technical indications of a mid-term bottom forming - as what follows is expected to be a rally of some 20-25% or more, lasting into well into the Spring of 2023. Stay tuned.
Jim Curry
The Gold Wave Trader
http://goldwavetrader.com/
http://cyclewave.homestead.com/
********


