Gold Forecast: Short-Term Bounce, Then Down Again


 Recapping Last Week
Last week's action saw Gold seeing a decent rally into a mid-week high, with the metal pushing up to a Wednesday peak of 1788.40. From there, a sharp decline was seen into Thursday's session, with the metal dropping all the way down to a low of 1737.50 - before bouncing slightly off the same to end the week.
Gold's Near-Term View
For the short-term picture, as noted last weekend the next smaller-degree low was due to materialize with the 10 and 20-day cycles, with the 10-day wave shown again on the chart below:
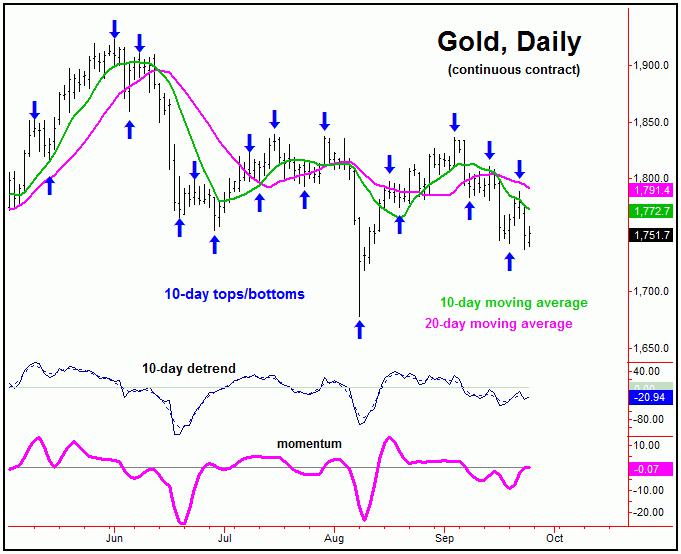
From last weekend: "the next short-term low is now due to materialize with the 10 and 20-day waves. Once the next trough does form with the 10 and 20-day cycles, then the probabilities should favor a nice short-term rally phase, one which takes Gold back to its 10-day moving average, at minimum, though with a rally back to the higher 20-day moving average being more ideal."
With the action from last week, Gold spiked up to a Wednesday high of 1788.40, thus hitting our minimum expected magnet, which called for a rally back to the 10-day moving average. Having said that, the metal fell just short of a tag of the higher 20-day moving average, which will normally be met during a 20-day cycle upward phase.
With the above said and noted, when a cycle fails to make a tag of its moving average, the market will often make another attempt at the same. With that, we may be nearing another short-term low and bounce phase with Gold.
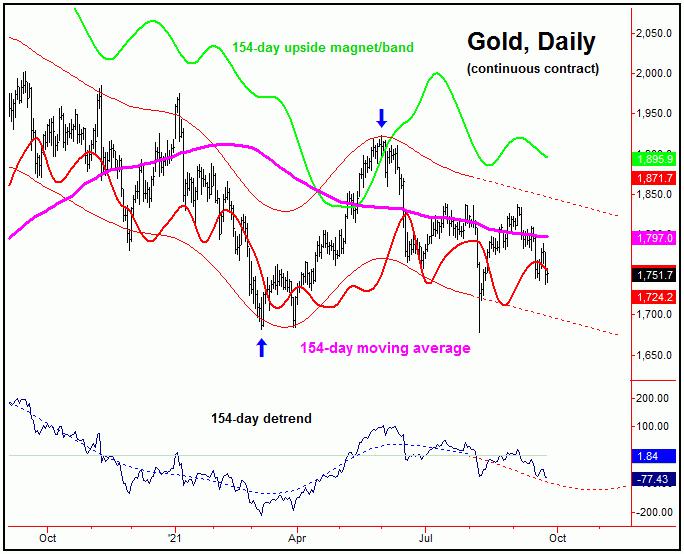
From last weekend: "With the recent daily close back below the 1756.00 figure (December, 2021 contract), the probabilities will now favor the next rally phase with the 10 and 20-day cycles to end up as a countertrend affair, holding below the 1836.90 swing top. If correct, lower lows should continue to play out into the late-October timeframe, where the next 154-day trough is projected to materialize."
As mentioned, the probabilities did favor the recent swing higher to end up as a countertrend affair - holding below the 1836.90 prior swing top. This was due to the position of the larger 154-day wave, which is deemed to be pushing lower into the late-October timeframe, plus or minus.
Here again is that 154-day cycle component:
Gold's 4-12 Week View
Stepping back then, the next low of significance is expected to come from the larger 154-day cycle, ideally made around the late-October timeframe, but with a decent plus or minus variance in either direction - simply due to the size of this component. In terms of price, the ideal path seems to favor a drop back to or below the 1677 swing bottom as this wave next troughs.
Adding to the notes above, the next low for the 154-day wave should also bottom the smaller 72-day component, which is shown on the next chart:
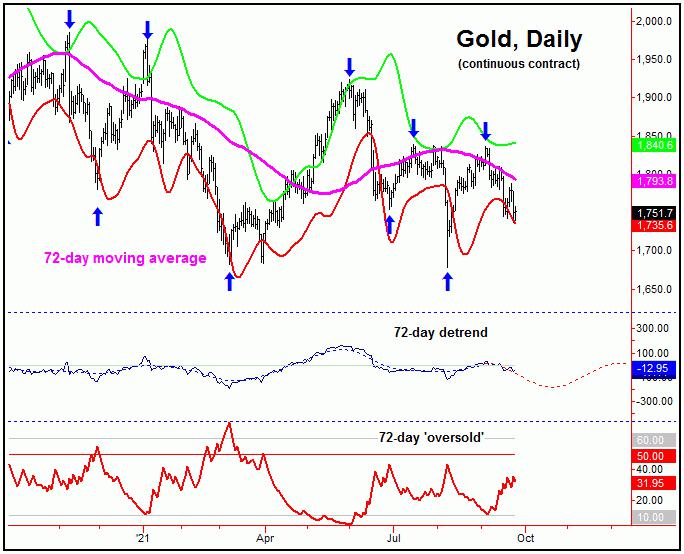
Something that we did not see at the early-August low (i.e., the last 72-day trough) was our 72-day 'oversold' indicator spiking back above its upper reference line - something that often occurs as this wave troughs (note: this indicator moves inversely to price action, similar to the VIX vs. the U.S. stock market).
With both the 72 and 154-day waves then seen as pointing south, a spike back above the upper 72-day 'oversold' line has a decent odds of being seen in the coming weeks, and is something we will be on the lookout for - since spikes above this line have a decent tendency to come near price lows for this 72-day cycle. The last such occurrence was seen right at the March bottom for Gold.
For the bigger picture, from whatever low that does form with the 72 and 154-day cycles, a larger percentage rally should be expected follow into early next year, one which is something in the range of 20% off the bottom - with the upper 154-day cycle band acting as the magnet. That same band (plus or minus) could also act as resistance to that upward phase, and could top this component sometime around next February - which is the also end of the normal bullish seasonal period for Gold. Stay tuned.
Jim Curry
The Gold Wave Trader
http://goldwavetrader.com/
http://cyclewave.homestead.com/
********
More from Gold-Eagle


