Gold Forecast: Short-Term Cycles Into Extended Territory


 Recapping Last week
Last week's action saw gold forming its bottom in Tuesday's session, here doing so with the tag of the 1845.40 figure. From there, a strong push higher was seen into later in the week, with the metal running all the way up to a Friday peak of 1905.00 - before backing slightly off the same into the daily/weekly close.
Gold, Short-Term View
For the very short-term, the upward phase of the 10 and 20-day cycles is still seen as being in force, with the next short-term peak expected to come from the combination of these waves.
Here is the smaller of these cycles, the 10-day component:
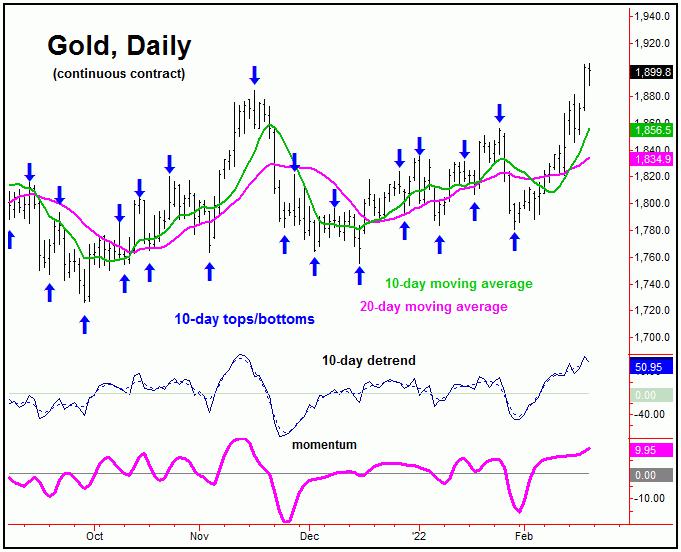
With the current upward phase of this 10-day cycle making higher highs past the 10 trading day mark (we are now 15 days along), this puts this wave well into extended territory. As mentioned last weekend, a cycle is seen as 'extended' when its upward phase is making higher highs on or past the average wave length.
With the above said and noted, we have found that an extended cycle has the above-average tendency to peak the wave of the next larger-degree. With that, the next short-term peak should not only top the 10-day wave, but should end up as the high for the larger 20-day component, shown on the next chart:
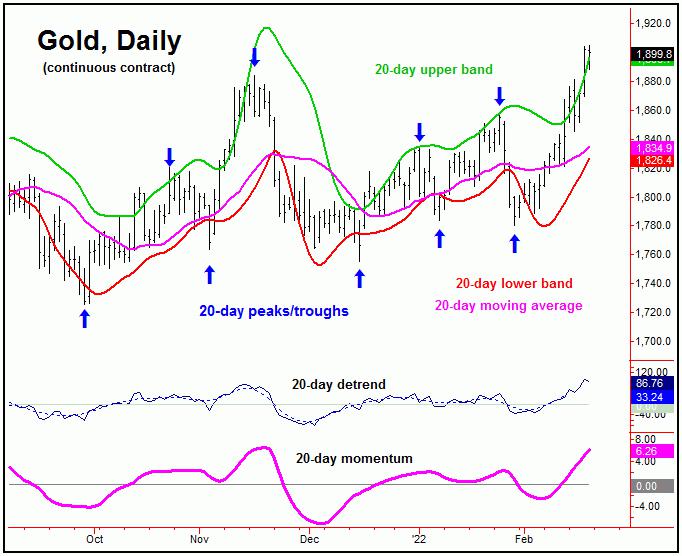
With the above said and noted, the next short-term correction phase should come from the 10 and the 20-day cycles. In terms of price, any reversal now below the 1845.00 figure (April, 2022 contract) would be the best indication of a turn south with these waves. This number is expected to rise sharply in the coming days, with the latest number always posted in our Gold Wave Trader market report.
The next downward phase of the 10 and 20-day cycles - once in force - should see the 10-day moving average acting as the minimum expected magnet, though with the lower 20-day moving average acting as the more ideal magnet; that same moving average could also provide key support. If that move should end up as a countertrend affair (against the late-January low), then a push back to higher highs can be seen on the next upward phase of these waves.
Gold's 3-5 Week View
From the comments made in past articles, our larger 72-day cycle last bottomed-out into mid-December of last year. From there, the current upward phase of this wave was projected higher into the mid-January to mid-February region - where it is now looking set to peak.
Here again is that 72-day component:
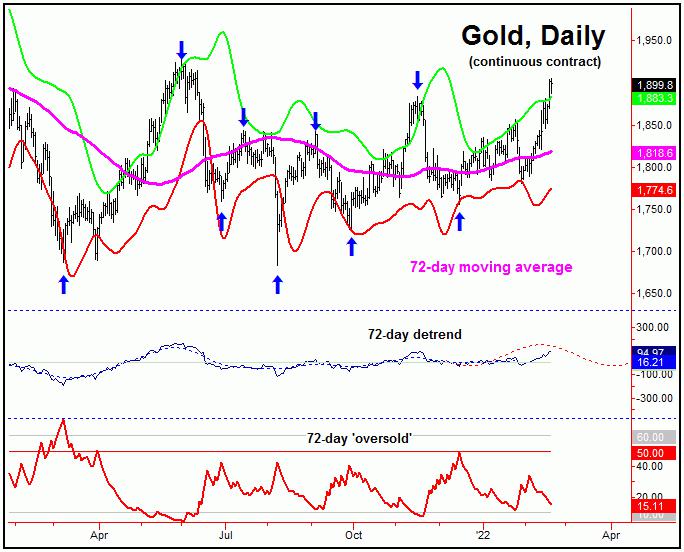
With the action seen in recent weeks, gold has never actually confirmed a turn south with this 72-day cycle, and with that its current upward phase remains intact. In other words, each of the declines into the shorter-term bottoms (i.e., 10 and 20-day cycles) have managed to remain above the downside reversal levels for this 72-day wave, thus keeping it pointing higher.
With the above said and noted, any daily close below the 1836.90 figure (April, 2022 contract) - if seen at any point going forward - would infer our 72-day cycle to have topped. Otherwise, holding above that number on a closing basis will keep the upward phase of this wave in force. This reversal figure should also move up as we move along, with the latest numbers always posted in our Gold Wave Trader report.
In terms of technical action, as mentioned last weekend there is a particular setup that we are watching, one which - if seen - would likely signal the end of the short-term run in gold (though not the bigger uptrend).
That is, if we were to see gold closing above its upper 72-day cycle band - which it is now being seen - along with a spike below the 72 'oversold' indicator's lower reference line, that action would be the signal that we are at or nearing a peak with our 72-day component. Currently, we have only one of these requirements being met, though we are keeping a close eye on this as we move along.
Gold's Mid-Term Picture
From whatever high that does end up being seen with this 72-day cycle, the odds will favor a decent correction playing out into what is projected to be early-April, plus or minus. In terms of patterns, due to the new indications from our longer-term 310-day cycle, we anticipate only a countertrend decline with this wave into that timeframe, one that now holds above the December, 2021 trough of 1755.30.
Here is that bigger 310-day component:
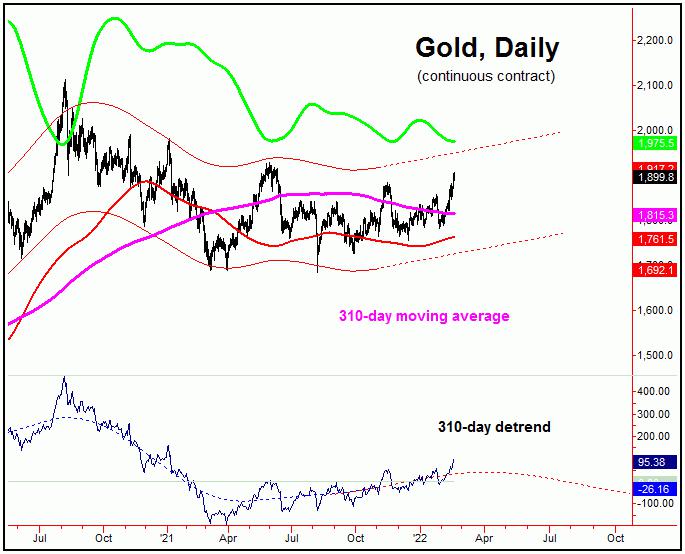
As we mentioned in our market reports, the 310-day cycle channel had recently made a turn back to the upside - thus inferring the August, 2021 low as the last bottom for this wave. With that, the overall assumption is that this cycle is currently heading higher into late-Summer of this year, before turning south again into later this year, where its next low would be due.
With the action from the 310-day wave, this tells us to expect the next downward phase of the 72-day wave (into April) to end up as the aforementioned countertrend affair - ideally holding above the last 72-day trough of 1755.30. If correct, the probabilities will favor a push back above the highs again on the next upward phase of this 72-day component, likely lasting well into the Summer months, before attempting to peak the bigger 310-day component. Stay tuned.
Jim Curry
The Gold Wave Trader
http://goldwavetrader.com/
http://cyclewave.homestead.com/
********


