Gold Forecast: What's Next? 'Kill' Date Nails Top In U.S. Stocks


 Last week's trading saw the gold forming its high near Monday's open, here doing so with the tag of the 1879.70 figure. From there, a sharp decline was seen into later in the week, with the metal dropping all the way down to a Friday low of 1761.20 - also ending the day and week at or within earshot of the same.
Technicals Warned in Advance
As mentioned in recent articles, the month of June had the potential for a painful decline in gold, which has obviously played itself out with the recent action. That is, the metal is now down over 150 points from the peak of 1919.20, registered back on June 1st.
With the above said and noted, technical action warned of a decent decline playing out into June, though the recent decline has been even more than expected. Take a look again at the chart below:
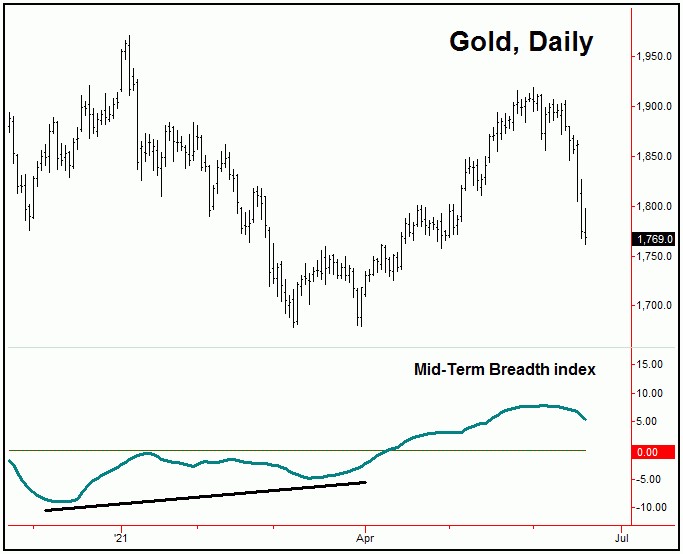
The chart above shows our Mid-Term Breadth index for the gold market, which turned to the downside earlier this month - and which continues to point lower at the present time, and thus is an obvious technical negative, at least for the short-term picture.
On the flip side to the above, longer-term momentum - which is more key to the bigger picture - is still pointing higher at the present time, with this indicator shown on the chart below:
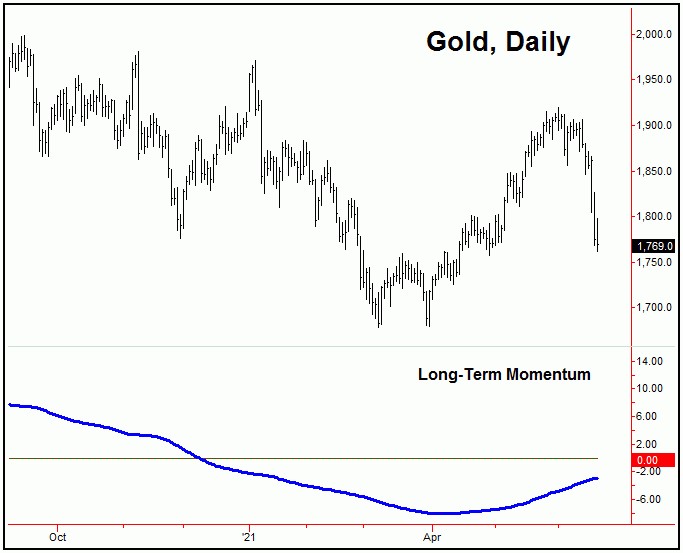
Should long-term momentum also turn down, then it may be a signal to 'get the heck of out of dodge' - meaning that something bigger is in the works for the gold market. With that, what we would like to see - for the mid-term (bullish) case - is for the metal to stabilize in the coming days. We will see how this develops heading into the new week.
Short-Term Picture for Gold
Regardless of the above, the next smaller-degree low is expected to come from the 10-day cycle component, which is shown on the chart below:
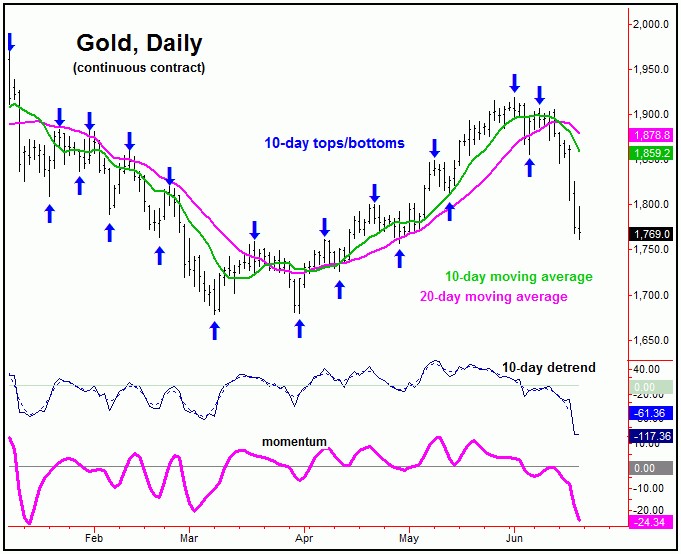
In terms of time, our 10-day cycle for gold is now some 10 trading days along - and with that is at or into normal bottoming territory. In terms of price, however, it would take a reversal back above the 1799.00 figure (August, 2021 contract) to confirm this wave to have turned, a number which should start to drop going forward - with the latest numbers always reported in our Gold Wave Trader outlook.
Once the next trough for our 10-day cycle is set in place, then the odds should favor a quick rally back to the 10-day moving average on its next upward phase. In terms of patterns, that rally looks favored to end up as a countertrend affair, against the prior 10-day peak of 1906.90. From there, a drop to lower lows could set up key technical divergences, which are needed in order to set up the next bottom for the metal.
June 'Kill' Date Nails Top in U.S. Stocks
As mentioned in an article posted earlier this month, we had a 'kill' date for the recent U.S. stock market rally, which, in our Market Turns report (which tracks the U.S. stock market), was identified as June 10th, plus or minus a day either direction. With that, our recent prior long position in the SPY - taken at the mid-May bottom - was exited into that June 10th date, at or near the highs for the move.
Adding to the notes above, we have a new 'vacuum' date for the U.S. stock market, which is a date which should draw prices down into. This date is where we expect the next key short-term low to form, with this date noted in the daily version of our Market Turns report.
For the mid-term picture, however, take a look at the next chart:
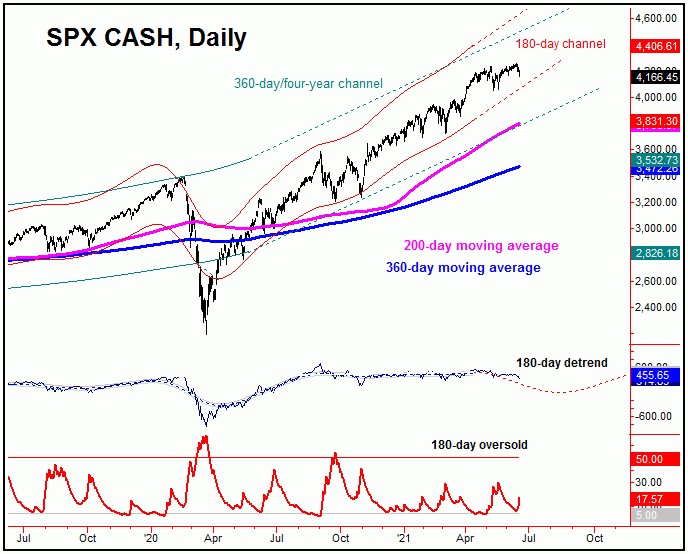
The chart above shows the larger 180-day cycle in U.S. stocks, which is next projected to trough into late-Summer or very early-Autumn of this year. Based upon the position of this wave, there is a huge amount of downside risk for the market, with this cycle having a strong tendency to revert prices back to the 200-day moving average on the SPX. Note that this same 200-day moving average is also at or near the bottom of our rising (and extrapolated) 360-day and four-year cycle channel, thus making this a key support level going forward.
Even with the above said and noted, it is still too early to actually confirm a peak in place with this 180-day wave, though the momentum indicators that track the same are now starting to turn south. What we are expecting is a key short-term bottom near our 'kill' date, followed by either a sharp countertrend rally in the coming weeks - or else, at best, only a marginal new high in price, before our bigger 180-day component starts to exert its dominance. Stay tuned.
Jim Curry
The Gold Wave Trader
http://goldwavetrader.com/
http://cyclewave.homestead.com/
********


