Gold from Time Biding to Price Sliding


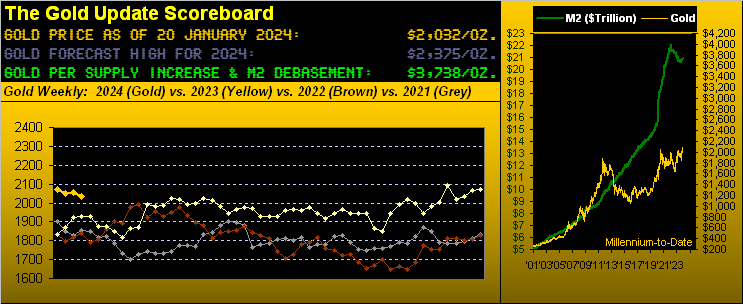
Wherein a week ago we wrote of “Gold Biding Time”, the yellow metal has since proceeded from time biding to price sliding, settling this past week yesterday (Friday) at 2032. And from our purview, purely the culprit appears technical. Indeed as previously penned: “Still by a whole host of daily mainstream technicals, Gold can be couched at present as rather namby-pamby.“
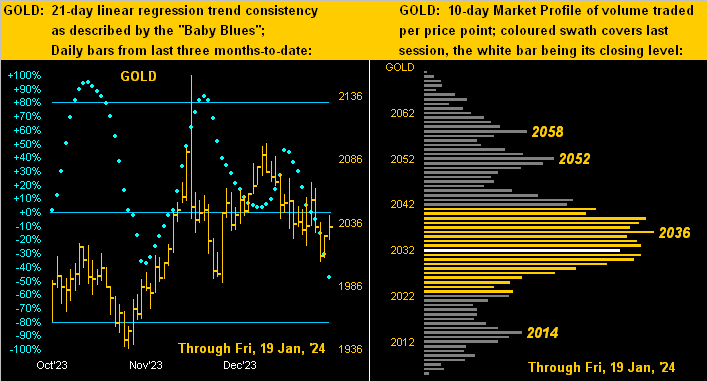
To wit, let’s go ’round the horn with our preferred technical studies (those currently best appearing on the website’s “Market Rhythms” page). At present via Gold’s daily candles: the Parabolics are Short, the MACD (“moving average convergence divergence”) is Short, the Price Oscillator is Short, the Moneyflow (canned data-provider version) is Short … and the 13/89 EMA (“exponential moving average”) is approaching a negative crossover to Short. Such current conditions are denoted below on our master analytics chart, the time frame being the past 42 trading days (two months):

‘Course, do not disregard therein our long-standing cogent comment that “Shorting Gold is a bad idea” if for no other reason that opening “up-gaps” can wipe out one’s trading account without even a millisecond to intervene. See, for example, 19 March 2009, 16 March 2020, 28 February 2022, 04 August 2023, et alia. Were Smart Alec Short, say, 100 Gold contracts going into any of those four days alone, his trading account at the open would have been creamed by an average of -$387,500 … just in case he’s still licking his wounds at home, (let alone if he’s even around anymore). A word to the wise is sufficient. Or as a savvy StateSide investor once quipped: “Whenever I buy Gold, I then hope for the price to go down as it’s like having an insurance policy with declining premiums.” Wise indeed.
However, from the infamous “Nothing Moves in a Straight Line Dept.” Gold’s negative technicals are such that the weekly parabolic Long trend per the blue dots next shown may be nearing its end, with a test of the 2020-1936 zone of structural support then in the balance. With Gold presently priced at 2032, ’tis but +35 points above the flip-to-Short level at 1997: given Gold’s “expected weekly trading range” is now 64 points, the 1997 price is not that distant to avoid being penetrated in the ensuing week, barring price firming up and out of the chute to still higher ground. But with money once again pouring into the earnings-less Casino 500, Gold (as is usual anyway) is out of favour … just make sure you own some. Here’s the weekly bars graphic:
Moving on to the Economic Barometer, 10 of the past week’s 15 incoming metrics improved period-over-period: thus an ongoing boost to the Baro. The one statistic that completely gob-smacked us was The University of Michigan’s “Go Blue!” Sentiment Survey. Not only did it record its highest reading since that for July 2021, but the month-over-month leap was the largest since that for September 2008 when in fact ’twas all going wrong with the FinCrisis. What are they smokin’ over there in Ann Arbor? Goodness gracious. (Did anybody note January’s New York State Empire Index fell from -14.5 to -43.7, its poorest reading since 2020’s COVID springtime?) But bring on December’s booming Retail Sales and up went the Baro. And duly note the green bit therein:
“Worst start to Earnings Season in memory, mmb?“
Across our 14 years of recording earnings, Squire, we’ve never seen a start worse than this. Rightly however, as we “tweeted” (@deMeadvillePro) this past Thursday: “This may be statistically insignificant as ’tis very, very early in Q4 Earnings Season.” And yet through the balance of the week, the poor trend continued. Specific to the S&P 500: 31 companies have thus far reported, of which just a scant nine (29%) bettered their bottom lines over Q4 of a year ago. In our records, that is worse than the S&P’s worst prior all-in quarter which registered only 36% having bettered for Q2 of COVID-plagued 2020.
And yet, the Casino 500 yesterday recorded its first all-time high (4842) since that on 04 January 2022 (4819). To again reprise the late, great Vince Lombardi: “What da hell’s goin’ on out dere?!?!?”
This really is becoming scary. One can be securely safe in U.S. Treasuries at triple the yield of S&P 500. But maybe that’s not considered fun. Surely it shan’t be fun should the stock market shut because the money doesn’t exist to fund folks’ stock sales. Today, obviously teaching Personal Finance at the undergraduate level is a waste of time. Remember our herein quoting Jerome B. Cohen: “In a bear market many stocks will sell at 5 to 7 times earnings, while in bull markets the average level would be about 15 to 18 times earnings.” As penned on the above Econ Baro, the “live” price/earnings ratio right now for the Casino 500 is 49.7x. If you don’t believe it, do something your broker can’t do … the math:
As for having to pass Portfolio Theory at the graduate level, forget about it: ’tis no longer needed given earnings no longer have meaning.
But wait, there’s more. Shame on you if not following the website’s S&P MoneyFlow page. And WOW did it whirl ’round this past week to upside. Here’s the problem: decade-to-date (the S&P’s closing span being from 3701 to now 4840) the average amount of money requisite to move the S&P up or down one point is $1,100,278 … as of yesterday the actual amount is a thin $540,068. That essentially means this “record-setting rally” is frothy and built on a lot of small trading block BS (can we print that, Mr. Editor?)
The point is: if you’re wedded to stocks, be wary to withstand having a hellova haircut. ‘Tis coming and ’twill be comprehensively butt-ugly. Or as we’ve on occasion quipped: “Market-to-market, everybody’s a millionaire; market-to-reality, they ain’t worth squat.” Write it down.
Meanwhile as cited, Gold’s price continues to be written down of late. In our two-panel graphic at left the old adage of “Follow the blues instead of the news, else lose your shoes” is in full cavort (but best not to go Short). Then at right, Gold’s 10-day Market Profile finds price rather clinging to the final bulge of support:
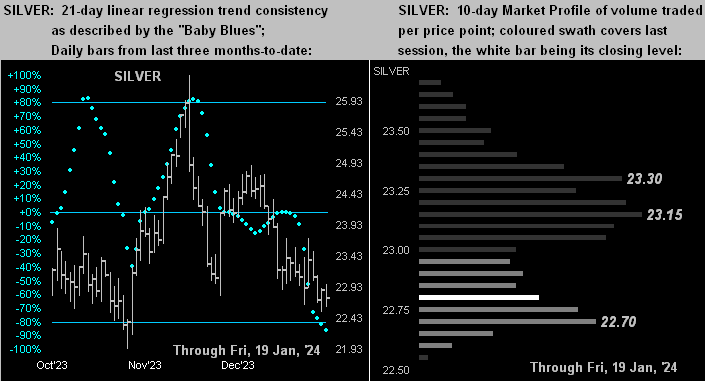
And pretty much the same can be said for Silver, albeit her three months of daily bars (below left) lack Gold’s on balance (yet waning) upside bent, justifying the Gold/Silver ratio now 89.3x, its highest level since 10 March of last year. Per the Market Profile (below right) 22.70 shows as Sister Silver’s final level of near-term trading support:
Before our final quip to close, let’s see what the Gold stack shows:
The Gold Stack
Gold’s Value per Dollar Debasement, (from our opening “Scoreboard”): 3738
Gold’s All-Time Intra-Day High: 2152 (04 December 2023)
Gold’s All-Time Closing High: 2092 (01 December 2023)
The 2000’s Triple-Top: 2089 (07 Aug ’20); 2079 (08 Mar ’22); 2085 (04 May ’23)
2024’s High: 2088 (02 January)
10-Session “volume-weighted” average price magnet: 2037
Trading Resistance: 2036 / 2052 / 2058
Gold Currently: 2032, (expected daily trading range [“EDTR”]: 26 points)
Trading Support: 2014
10-Session directional range: down to 2005 (from 2071) = -66 points or -3.2%
2024’s Low: 2005 (17 January)
The Weekly Parabolic Price to flip Short: 1997
The 300-Day Moving Average: 1937 and rising
The Gateway to 2000: 1900+
The Final Frontier: 1800-1900
The Northern Front: 1800-1750
On Maneuvers: 1750-1579
The Floor: 1579-1466
Le Sous-sol: Sub-1466
The Support Shelf: 1454-1434
Base Camp: 1377
The 1360s Double-Top: 1369 in Apr ’18 preceded by 1362 in Sep ’17
Neverland: The Whiny 1290s
The Box: 1280-1240
Indeed to close, let’s go to the Swiss snows at the WEF (World Elites’ Forum) wherein the “It Doesn’t Apply to Us Dept.” was in full folly, (as you may well have already heard). The “emphasis” of this year’s Davos boondoggle being “Climate Change” and “AI”, one John Forbes Kerry — THE U.S. Special Presidential Envoy for Climate (his having previously been both U.S. Secretary of State and U.S. Senator from The Commonwealth of Massachusetts, as well as having served in Viet Nam) — was media-queried in reference to the 1,000+ private jets having carbonized their way to either Zurich or St. Gallen-Altenrhein. The response: “That’s a stupid question”.
Which leads one to wonder what a Davos plat du jour was this year …
Avoid stoopid. Acquire Gold!
Cheers!
…m…
www.TheGoldUpdate.com
www.deMeadville.com
and now on “X”: @deMeadvillePro
*********

Mark Mead Baillie has had an extensive business career beginning in banking and financial services for two years with Banque Nationale de Paris to corporate research for three years at Barclays Bank and then for six years as an analyst and corporate lender with Société Générale.
For the last 22 years he has expanded his financial expertise by creating his own financial services company, de Meadville International, which comprehensively follows his BEGOS complex of markets (Bond/Euro/Gold/Oil/S&P) and the trading of the futures therein. He is recognized within the financial community of demonstrating creative technical skills that surpass industry standards toward making highly informed market assessments and his work is featured in Merrill Lynch Wealth Management client presentations. He has adapted such skills into becoming the popular author each week of the prolific “The Gold Update” and is known in the financial website community as “mmb” and “deMeadville”.
Mr. Baillie holds a BS in Business from the University of Southern California and an MBA in Finance from Golden Gate University.


