Gold Gains Ground on Premium Sound


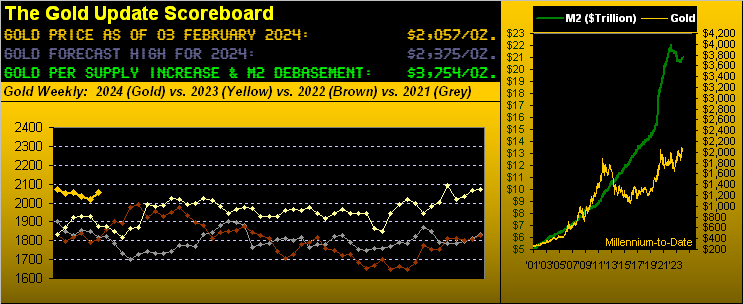
When we last left you a week ago, (albeit given the website’s daily updating we never really leave), we were eying Gold as languishing on a weekly basis, but on a daily basis ’twas set for some bounce. And that’s exactly how Gold ventured through this past week as priced by the ounce. The April Gold contract settled yesterday (Friday) at 2057, a gain for the week of 21 points (+1.0%). However as February’s contract was phased out, an additional +18 points of premium worked into that for April, the “all-in gain” for charting vis-à-vis the “continuous contract” thus +39 points (1.9%). Therefore by such construct, Gold was “saved” from having flipped its weekly parabolic Long trend to Short, as the blue dots below strive to survive yet another week in our year ago-to-date peek:

Note above on the rightmost weekly bar a small red “closing nub” (red arrow) which is where — sans premium — price would instead be, (i.e. near spot at 2039), and thus in that sense ’twas a rather muted up week. In fact, strictly by the weekly bars for both the outgoing February contract and incoming April contract, their individual weekly parabolic trends already have flipped from Long to Short: thus short-lived may be the still-Long “continuous contract” parabolic trend.
Too, the weekly negative technicals herein detailed in our prior missive have only stalled rather than improved with the bounce. Further per the Federal Open Market Committee’s “less dovish than FinMedia-desired” Policy Statement this past Wednesday, Gold’s road can remain a bit rocky as these next weeks unfold, perhaps with further testing of the 2020-1936 support structure in the balance.
And that segues nicely, it being month-end (plus two trading days), to our young year-to-date BEGOS Markets standings wherein we find the Bond -2.0% as yields are on the move up and the Dollar gets the bid. Yet incredibly and contrary to “conventional wisdom”, the S&P 500 is topping the table already +4.0%, even in the midst of a lousy Q4 Earnings Season:
“You say ‘lousy’, mmb? 75% of S&P companies have beaten estimates…“
Squire revels in playing this earnings game. Truth be told, only 56% of bottom lines have improved over a year ago, thus far making Q4 the sixth-worst S&P 500 Earnings Season of the past 27. Rising yields, a rising Dollar, scant earnings growth, and this Casino 500 sits at an all-time closing high (4959)? Ought we re-classify The Investing Age of Stoopid to that of Braindead?
But wait, there’s more: within several missives dating as far back as last mid-November, we’ve likened what we’ve been seeing in the Casino 500 to that which ultimately fed into the DotComBomb some two decades ago. And — late as they may be in figuring this out — major investment banks are (finally) seeing same. Hat-tip Bloomy for reporting last Tuesday that “JP Morgan Quants Warn of Dot-Com Style Concentration in US Stocks”, and then followed that yesterday with “BofA’s Hartnett Says Stock Markets Are Behaving Like Dot-Com Era”. Are the Big Banks at last actually doing the math?
The “live” price/earnings ratio of the Casino 500 is now 50.5x … and as we’ve previously noted, that is higher than ’twas at the outset of the DotComBomb, which high-to-low from 2000 into 2002 found the S&P “correct” more than -50% … just in case you’re scoring — or better yet preparing — at home. Because in reprising Bachman–Turner Overdrive from back in ’74: “You Ain’t Seen Nothing Yet”
‘Course, the “talk of the town” remains the so-called “Magnificent Seven”. Per yesterday’s settle, the combined market capitalization of: both Alphabet tranches, Apple, Amazon, Meta, Microsoft, Nvidia and Tesla represents 29.2% of the entire S&P 500. Their average P/E is now 46.5x (44.8x cap-weighted, were they in their own index of just seven companies). This is beyond lunacy by any historical measure.
Moreover as we’ve all along been wary, the annualized risk-free yield per yesterday’s settle on the three-month U.S. T-bill is 5.210%; that on the risk-all Casino 500 is 1.431%. (Further, as you regular readers well know, the market cap of the S&P is more than twice the readily available money supply to cover it … oops).
But back to Gold — the true hard asset currency dating at least as far back as Lydia’s King Croesus, circa 550 BC — ’tis time to bring up our year-over-year comparison of the yellow metal vis-à-vis its key equity brethren. So from worst to first we’ve: Newmont (NEM) -37%, Franco-Nevada (FNV) -28%, Pan American Silver (PAAS) -27%, the Global X Silver Miners exchange-traded fund (SIL) -17%, Agnico Eagle Mines (AEM) -15%, the VanEck Vectors Gold Miners exchange-traded fund (GDX) -14%, but Gold itself +5%. Does this mean the price of Gold (2057) is too high? Hardly, given our opening Gold Scoreboard’s valuation (3754). But in this goofball era of “The Magnificent Seven, or Nothing!”, the precious metals remain the wallflowers. It shan’t last; (it never has). Here’s the graphic:
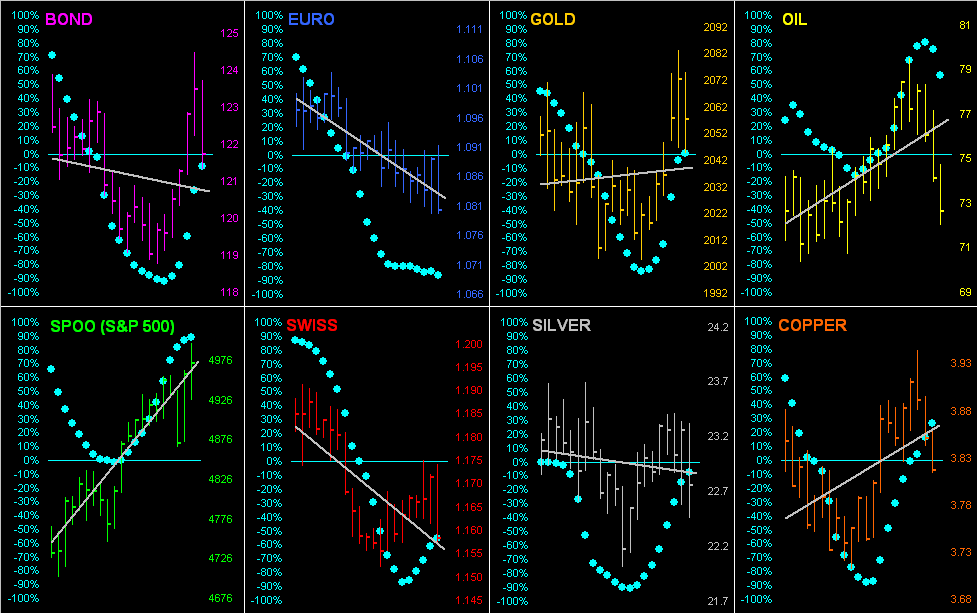
Next we can see the stance of the precious metals within the overall view of the BEGOS Markets in going ’round-the-horn for all eight components across the past 21 trading days (one month)-to-date. Therein is Gold with its mild uptrend, whilst Silver is sporting a mild downtrend. But that’s enough to now place the Gold/Silver ratio at 90.3x, its highest end-of-week reading since that ending 10 March of last year. We’ve said it before and we’ll say it again: Sister Silver is CHEAP! Here’s the whole gang, accompanied by each trend’s consistency per the baby blue dots:
Meanwhile, the once-pumped now rather defunct CNN is all excited: “Another shockingly good jobs report shows America’s economy is booming.” Really? Oh to be sure, the Department of Labor Statistics rounded up a net increase in January Payrolls of 353,000, the most since the same month a year (then 504,000). ‘Course two days prior to Labor, ADP came in with a net increase for private sector Employment of only 107,000 for January, the fourth-worst monthly reading since still COVID-ridden December 2021. Too, period-over-period metrics were less in January for both the Average Workweek and the Chicago Purchasing Managers’ Index, as well as for December’s Factory Orders and Q4’s Productivity. So is the economy truly “booming”? Of course ’tisn’t, albeit the Economic Barometer has been erratically ratcheting upward these last two months:
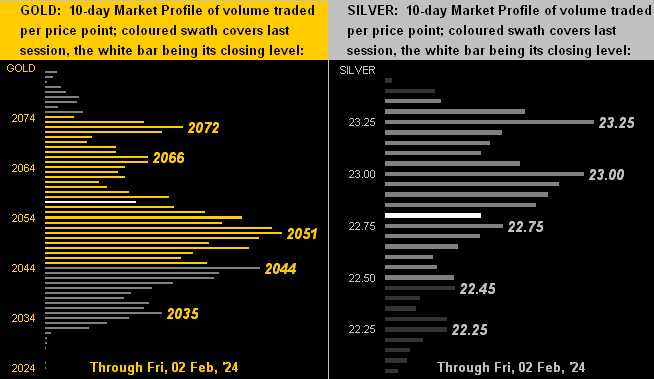
Erratic of late, too, is the trade of Gold and Silver. As we turn to their respective 10-day Market Profiles with Gold on the left and Silver on the right, both are priced ’round their mid-points, trading supporters and resistors as labeled:
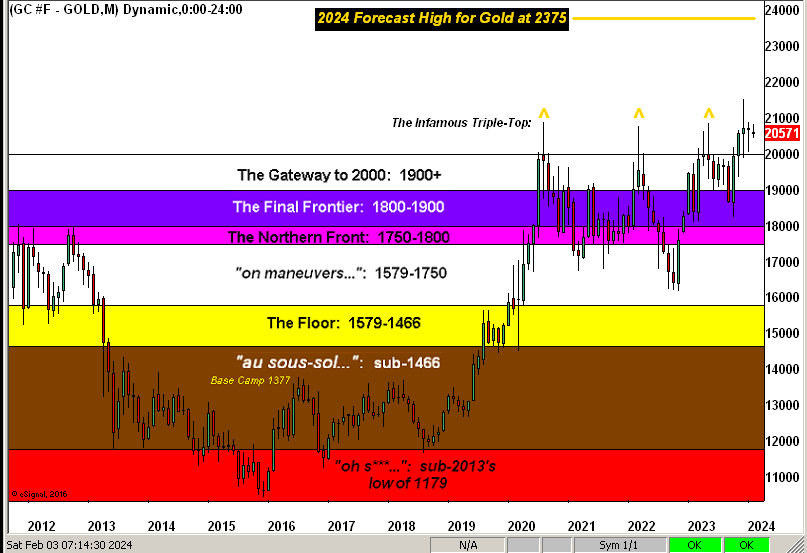
‘Course, we can’t let month-end pass without reviewing Gold’s Structure across the monthly bars for the past dozen years, (the rightmost candle encompassing just the first two trading days of February). So close is Gold to upside uncharted territory … and yet so far:
The ensuing week appears underwhelming for the Econ Baro: just five metrics are due. But for Q4 Earnings Season, another 98 reports are scheduled for the S&P 500 as the Index’s insanity continues … or starts to come to its senses. On verra…
‘Course, nothing is more sensible than having a little Gold!
Cheers!
…m…
www.TheGoldUpdate.com
www.deMeadville.com
and now on “X”: @deMeadvillePro
********

Mark Mead Baillie has had an extensive business career beginning in banking and financial services for two years with Banque Nationale de Paris to corporate research for three years at Barclays Bank and then for six years as an analyst and corporate lender with Société Générale.
For the last 22 years he has expanded his financial expertise by creating his own financial services company, de Meadville International, which comprehensively follows his BEGOS complex of markets (Bond/Euro/Gold/Oil/S&P) and the trading of the futures therein. He is recognized within the financial community of demonstrating creative technical skills that surpass industry standards toward making highly informed market assessments and his work is featured in Merrill Lynch Wealth Management client presentations. He has adapted such skills into becoming the popular author each week of the prolific “The Gold Update” and is known in the financial website community as “mmb” and “deMeadville”.
Mr. Baillie holds a BS in Business from the University of Southern California and an MBA in Finance from Golden Gate University.
More from Gold-Eagle


