Gold Gets A Bid; Stocks Resume Skid


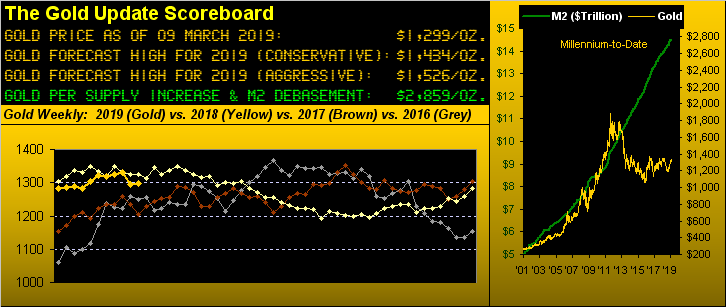
Gold is doing pretty darn well following its 24-week up run having turned down two weeks ago (as measured by the weekly parabolic trend). The two supportive areas to which we've repeatedly referred -- The Whiny 1290s and The Box (1280-1240) -- are thus far doing their part following price's fall from the year-to-date high of 1349 on 20 February to this past week's low of 1281. And given Mario Draghi's tepid EuroZone along with practically no growth in February's StateSide jobs creation, Gold settled out the week yesterday (Friday) at 1299, a nice 1.4% bounce off that low.
'Course, to look at the above Gold Scoreboard, this year's track-to-date remains meshed with those of the prior three years, reminding us that -- broadly -- price ain't really gone nowhere. But once Gold regains Base Camp 1377, cue Katie to bar the door -- or perhaps better stated -- throw it wide open as we expect the then ensuing mo-mo bull stampede to shoot price up toward our (conservative) forecast high for this year of 1434. And upon such event, those price tracks of the prior three years shall notably appear as sagging into history.
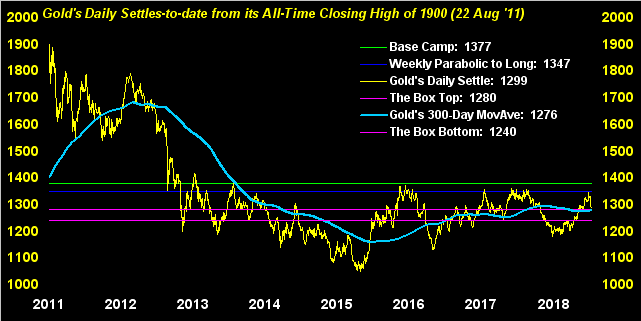
Now in turning to Gold's weekly bars, the dashed regression trend line across the entirety of the chart is perceptibly rotating from down toward up. Its rate of decline at the conclusion of 2018 was 2.6 points per week. Have slowed that rate ever since, its decline is now only 0.8 points per week. Barring Gold having a severe fallout, that dashed line in about a month's time ought thus be rising, almost coincident with some StateSiders having to liquidate assets to pay Uncle Sam his tyrannical income tax. April's gonna be fun. The latest data available (2016, i.e. before the newly revised tax code) from the Tax Foundation states the top 10% as paying nearly 50% of the overall tax burden. And if you're in that top 10% and need tax dough, where do you go? Got stocks? Uh-oh! Between now and then, let's look at least for Gold to hang in there:

Speaking of stocks, the S&P 500 fell 2.2% this past week. 'Course, the signs for a pullback, if not the overall resumption for a 27% correction (from the 2941 all-time high of 22 September) down to 2154 (that pre-Presidential Election resistance peak-turned-support) have been stark as we've regularly herein noted. Q4 Earnings Season was 2018's weakest; our live price/earnings ratio remains a ghastly high 29.9x, (Bob Shiller's Cyclically Adjusted PE finished the week at 30.0x); and our measure of how much money it takes to move the S&P one point has been plummeting, from $911k on 29 Jan now down to $648k: live in the froth, drown in its deluge. Which nicely segues us to the Economic Barometer and its relative demise whilst the S&P was making highs:
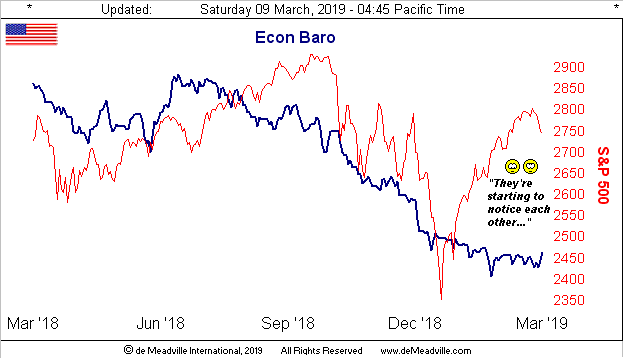
"But mmb, the jobs number was lousy and yet the barometer turned up?"
Squire, the Department of Labor Statistics' survey finding new payroll creation of only 20,000 for February was but one of 15 other metrics hitting the Baro this past week. Hourly Earnings leapt from a 0.1% increase to 0.4%; Q4 Unit Labor Costs increased from 0.9% to 2.0%; and the month's Institute for Supply Management's Services Index rose from 56.7 to 59.7. On balance, a bit better for the Baro. But the still staggeringly high S&P can't continue to hide from the Baro's overall slide. Then add in to all that the StateSide Trade Deficit hitting its widest level (-$59.8 billion) since July 2008 (-$61.3 billion), credit card debt closing out 2018 at an all-time high of $870 billion, and economic policy wonk Larry Summers pointing to "modern monetary theory" as a recipe for disaster, which is obviously why you want to own Gold. And the alarm clock to it all going wrong just keeps on a-tickin'.
Ticking higher (albeit barely) of its own accord is Gold's 300-day moving average. Once price's stalwart supporter, then repelling resistor, recent years have found it more of a central constant 'round which Gold oscillates. However, we give more importance to Gold's various measures of price structure, such as the aforementioned support levels. But we'll gladly take the average's now beginning to bend upward rather than downward:
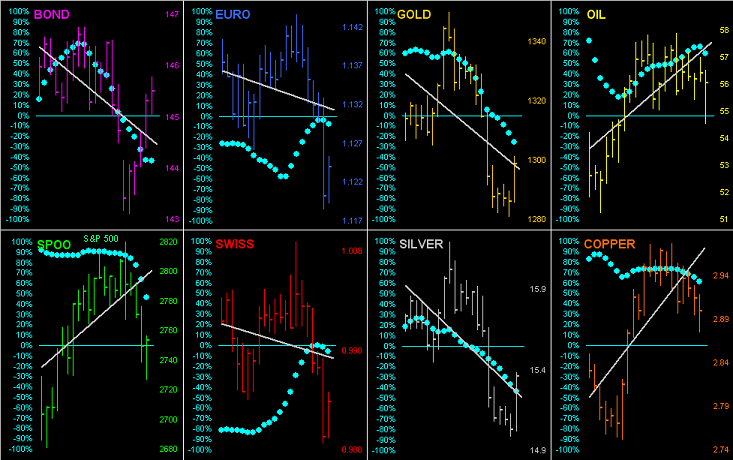
Now let's go 'round the horn for the BEGOS Markets (Bond, Euro/Swiss, Gold/Silver/Copper, Oil, S&P) from one month ago-to-date by their daily bars and "Baby Blues", the dots of linear regression trend consistency. And what leaps from this next graphic is obvious: the diagonal trend lines for all of the "safe haven" components (i.e. the Bond, the Euro, the Swiss Franc, Gold and Silver) are in descent, whilst those of the three economically-driven markets (i.e. Copper, Oil and the S&P) are in ascent. BUT: the most recent price action in each case appears contra to its trend, suggesting that 'tis all about to whirl 'round the other way. Oh to be early, (but oh to have stops, just in case: for as we oft say, cash management is more important that being directionally correct):
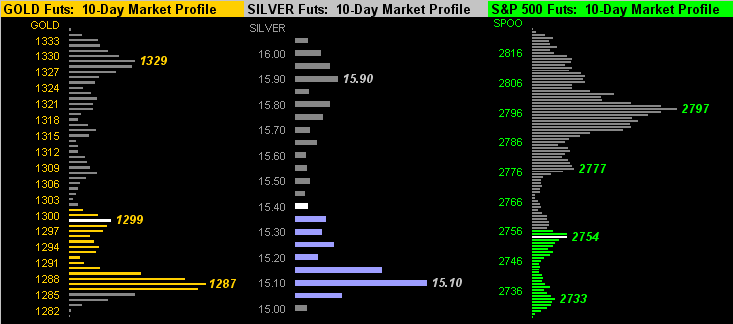
And thus to the 10-day Market Profiles for the Precious Metals as well as for the S&P 500 given the latter's overhead trading resistance appears so massive. Per usual, each horizontal bar represents the cumulative volume traded at the respective price point for the past fortnight, the white bar being the most recent settle. Pretty fair trading support there for both Gold (left) and Silver (center), but a limited upside road for the S&P (right), and especially so given all of its aforementioned negatives:
As for the overall Gold Stack, here 'tis:
The Gold Stack
Gold's Value per Dollar Debasement, (from our opening "Scoreboard"): 2859
Gold’s All-Time High: 1923 (06 September 2011)
The Gateway to 2000: 1900+
Gold’s All-Time Closing High: 1900 (22 August 2011)
The Final Frontier: 1800-1900
The Northern Front: 1750-1800
On Maneuvers: 1579-1750
The Floor: 1466-1579
Le Sous-sol: Sub-1466
Base Camp: 1377
The 1360s Double-Top: (1362 in Sep '17 and 1369 in Apr '18)
2019's High: 1349 (20 February)
The Weekly Parabolic Price to flip Long: 1347
10-Session “volume-weighted” average price magnet: 1305
Trading Resistance: here at 1299, then 1308 / 1316 / 1322 / 1329
Gold Currently: 1299, (expected daily trading range ["EDTR"]: 13 points)
Neverland: The Whiny 1290s
Trading Support: 1287
10-Session directional range: down to 1281 (from 1335) = -54 points or -4.0%
The Box: 1280-1240
The 300-Day Moving Average: 1276 and rising
2019's Low: 1275 (24 January)
We'll finish off with these three observations:
■ "They're baaack..." Recall The Gold's Update's "mini-series" entitled ? We couldn't help but remember that soapy saga upon reading this past week that for the first time in nine years -- and still under the administration of Prime Minister Alexis "Tieless" Tsipras -- Greece is rolling out ten-year notes for which 'tis said some €10 billion of orders have already been received. So do we revive the series? (Stay tuned...)
■ What on earth has happened to the once Mighty Barron's? We teased at this a couple of missives ago, but 'tis getting rampant over there at the so-called in-depth sophisticated financial wing of the Dow Wires syndicate. One gets the impression that their writers' pool is populated by children as the schoolish headlines continue, a choice one this past week being "Dow Drops 200 Points Because the Market Sees Weakness Everywhere". It came on the heels from just 24 hours earlier that "The Stock Market Could Keep Climbing Because Momentum Isn’t Dying" Wow. Futures and indices move for a bazillion different reasons from a bazillion different trading entities at any given moment. Moreover, if Grandpa Hugh was still at the helm today, he'd be firin' folks left and right ... or more likely given his stoic disciplinary nature, have hired adults in the first place. Just sayin'...
■ And lastly, following this past busy week of 16 incoming metrics for the Econ Baro, next week brings 17 additional data points. All of this as governmentally-released reports play catch up from the recent shutdown. So mind that Baro!
Mind too the price of Gold as all of this underlying support is a real holding test for our yellow metal!

Mark Mead Baillie has had an extensive business career beginning in banking and financial services for two years with Banque Nationale de Paris to corporate research for three years at Barclays Bank and then for six years as an analyst and corporate lender with Société Générale.
For the last 22 years he has expanded his financial expertise by creating his own financial services company, de Meadville International, which comprehensively follows his BEGOS complex of markets (Bond/Euro/Gold/Oil/S&P) and the trading of the futures therein. He is recognized within the financial community of demonstrating creative technical skills that surpass industry standards toward making highly informed market assessments and his work is featured in Merrill Lynch Wealth Management client presentations. He has adapted such skills into becoming the popular author each week of the prolific “The Gold Update” and is known in the financial website community as “mmb” and “deMeadville”.
Mr. Baillie holds a BS in Business from the University of Southern California and an MBA in Finance from Golden Gate University.


