Gold To Gold Stock Index Ratio Charts Portend Massive Prolonged Sector Bull Market...


While the subject of this article, the ratios of the main Precious Metal stock indices to the price of gold, may seem rather dry and statistical and thus boring, if you are interested in weighing up the prospects of making serious money in the PM sector going forward it is not boring at all, especially as we don’t have to engage in any tedious number crunching or sifting through a great pile of statistics because, as ever, we boil it at all down to simple common sense comparison by means of our graphs.
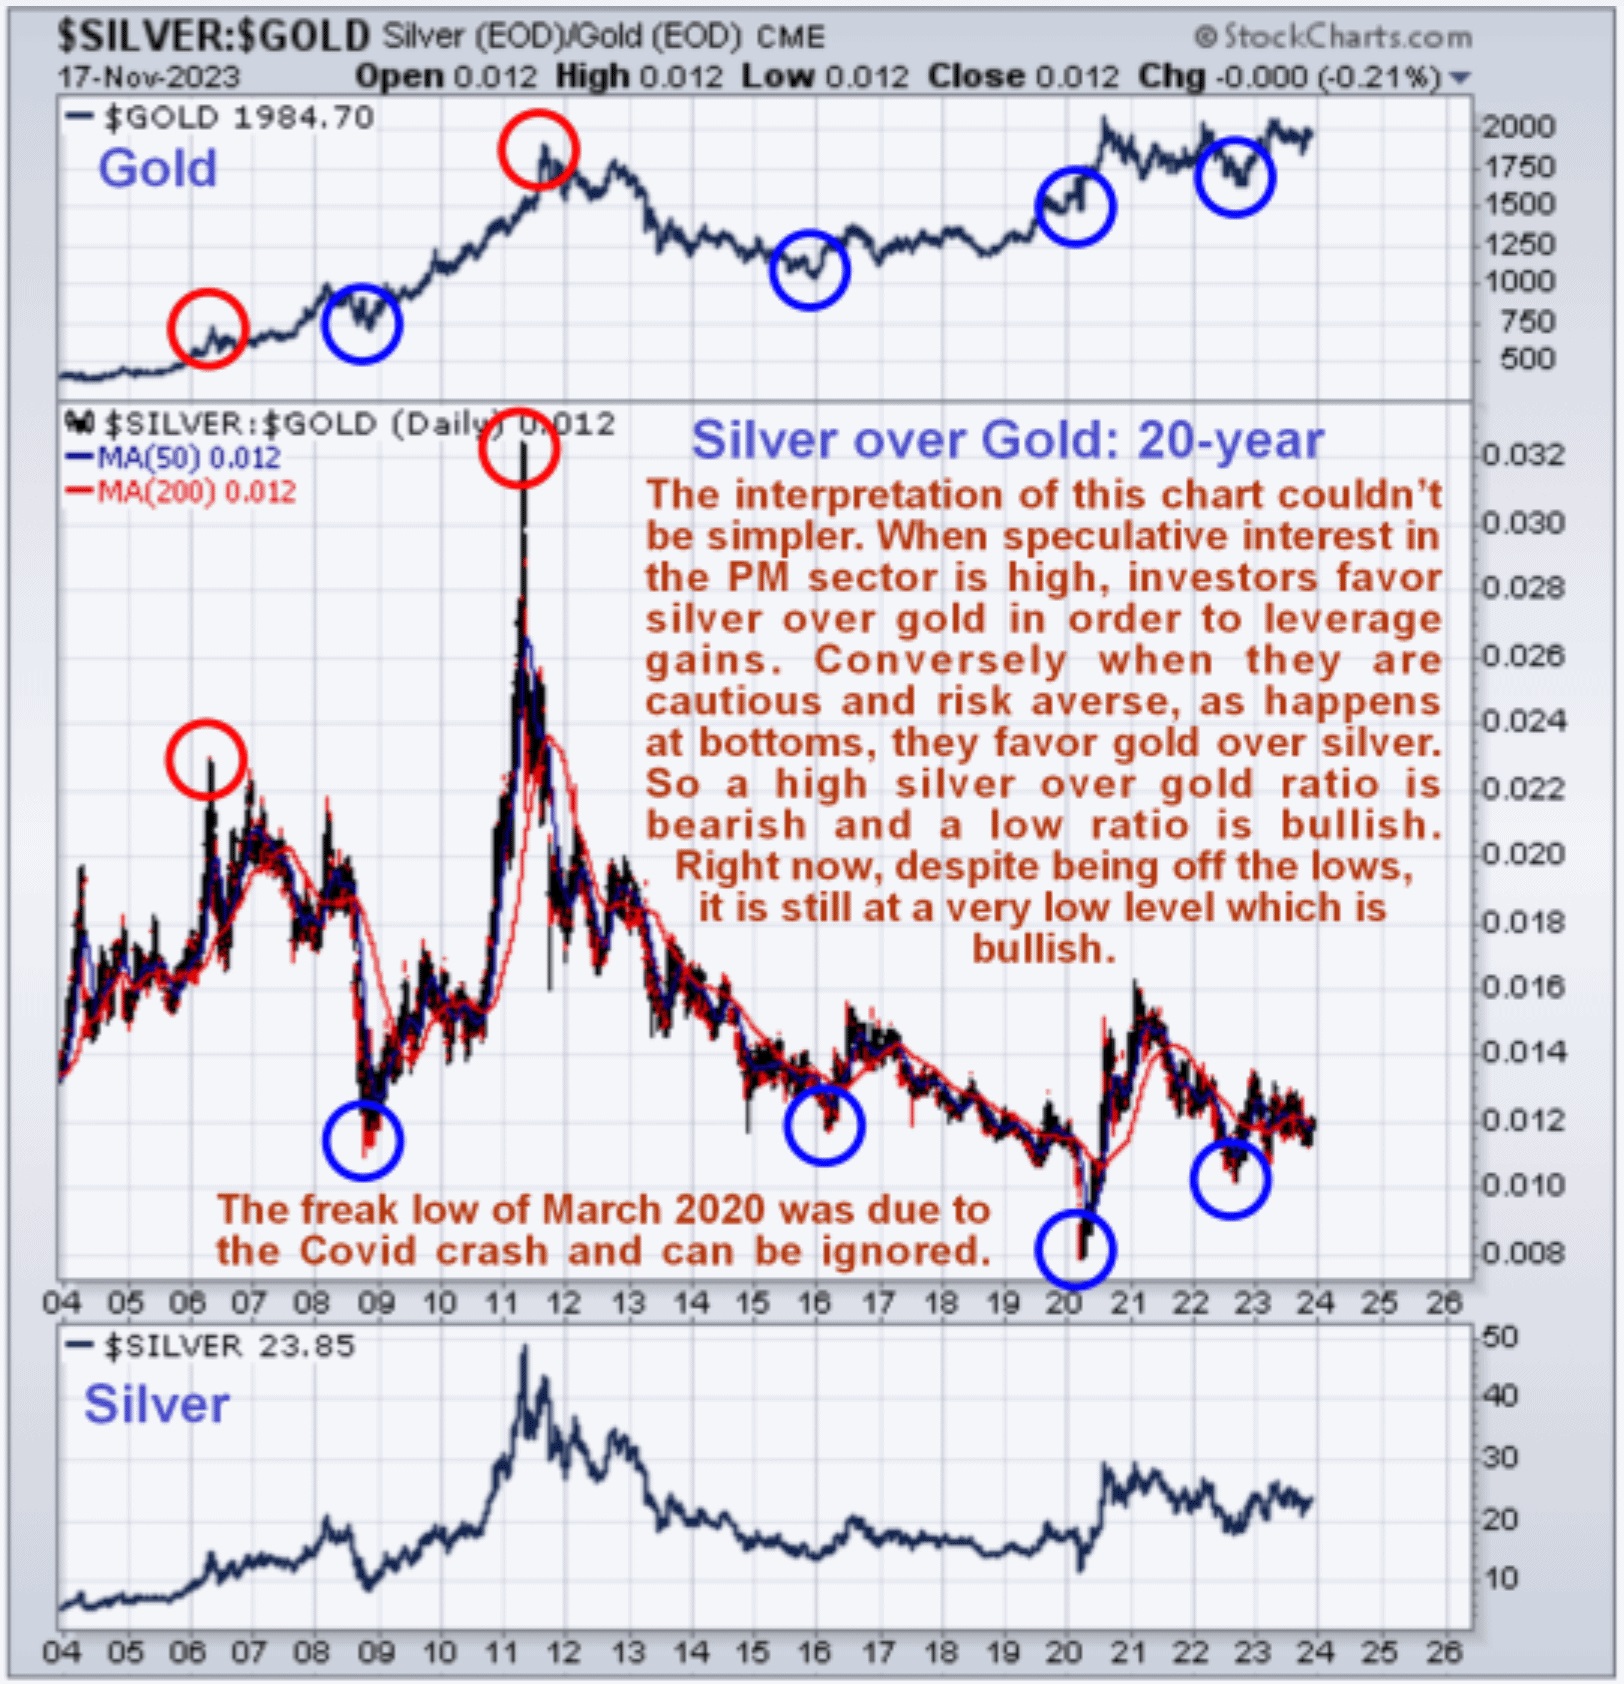
You may recall how we looked at the long-term silver to gold ratio chart in the last gold and silver market updates where we observed that this ratio is now at a comparatively low level, and concluded that this was bullish for the sector for the simple reason that when there is low speculative interest in the sector, investors are more interested in gold than silver, because they are more interested in safely than the prospect of speculative gains. When the reverse is true and there is rampant speculative interest, investors favor silver over gold in an effort to maximise gains which is is why high readings and peaks in this ratio tend to mark tops. This chart is reproduced below for convenience so we can remind ourselves of the current setup…
Now here’s the thing – it’s the same with PM stocks versus gold. When investors favor PM stocks more over gold, as was the case back in 2011, and PM stock indices are high in relation to gold, then it is an indication of strong speculative interest which is likely to mean that the sector is at or close to a top. When the opposite is the case and the stock indices to gold ratios are close to historical lows – as is the case now – it is an indication that the sector is at or close to a bottom. So what we are now going to do is look at long-term charts first of all for the XAU index relative to gold, with the XAU being comprised of large cap gold and silver stocks, and follow that with a look at the long-term charts for the HUI index relative to gold, with the HUI index being weighted more in the direction of mid-cap stocks, although it includes big ones too.
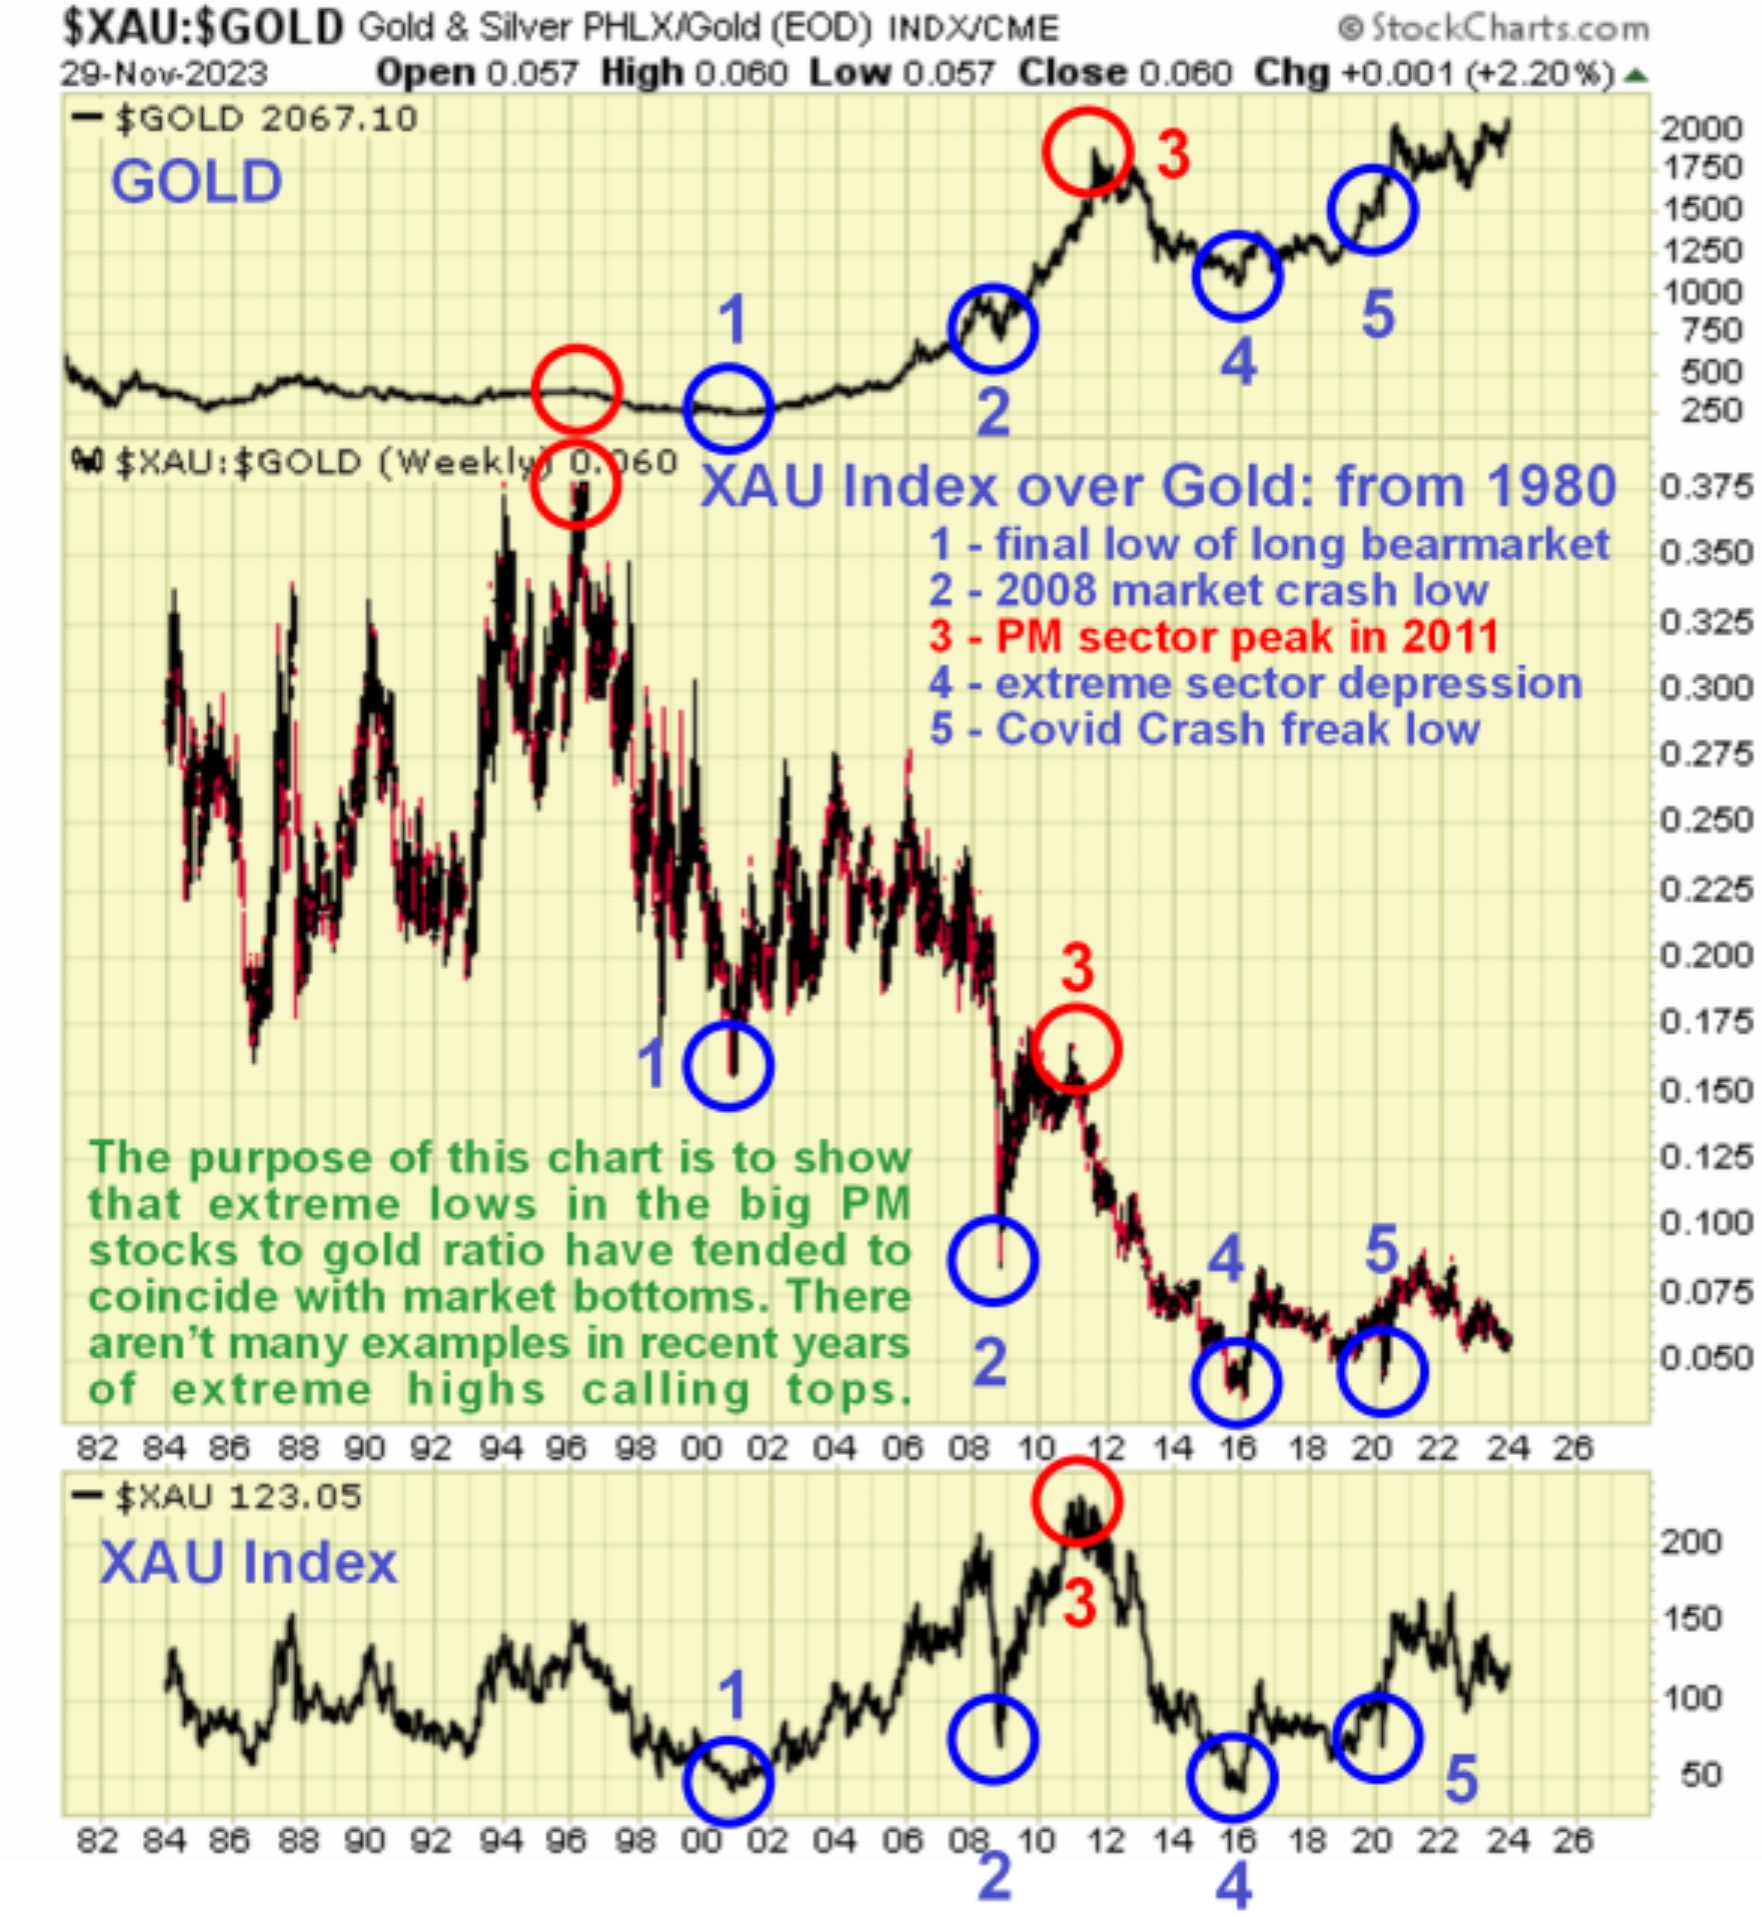
Starting with the very long-term XAU index to gold chart, which goes way back to 1980, we see that this ratio is now at a very low level historically, which has only been significantly exceeded on the downside on two occasions - by the extreme sector depression lows of late 2015 - early 2016 and briefly by the Covid Crash lows of March 2020. Remarkably, this ratio is now at about one-sixth of the peak it attained way back in 1996. What this indicates, simply put, is that gold stocks are now extremely cheap relative to gold itself which means that, if they only partially return to the mean, they should make handsome gains from here going forward. Is it not therefore interesting to note that, after several years of consolidating, and with the imminent prospect of a dollar collapse and hyperinflation, gold is right on the verge of breaking out to new highs that is expected to trigger a massive runup?
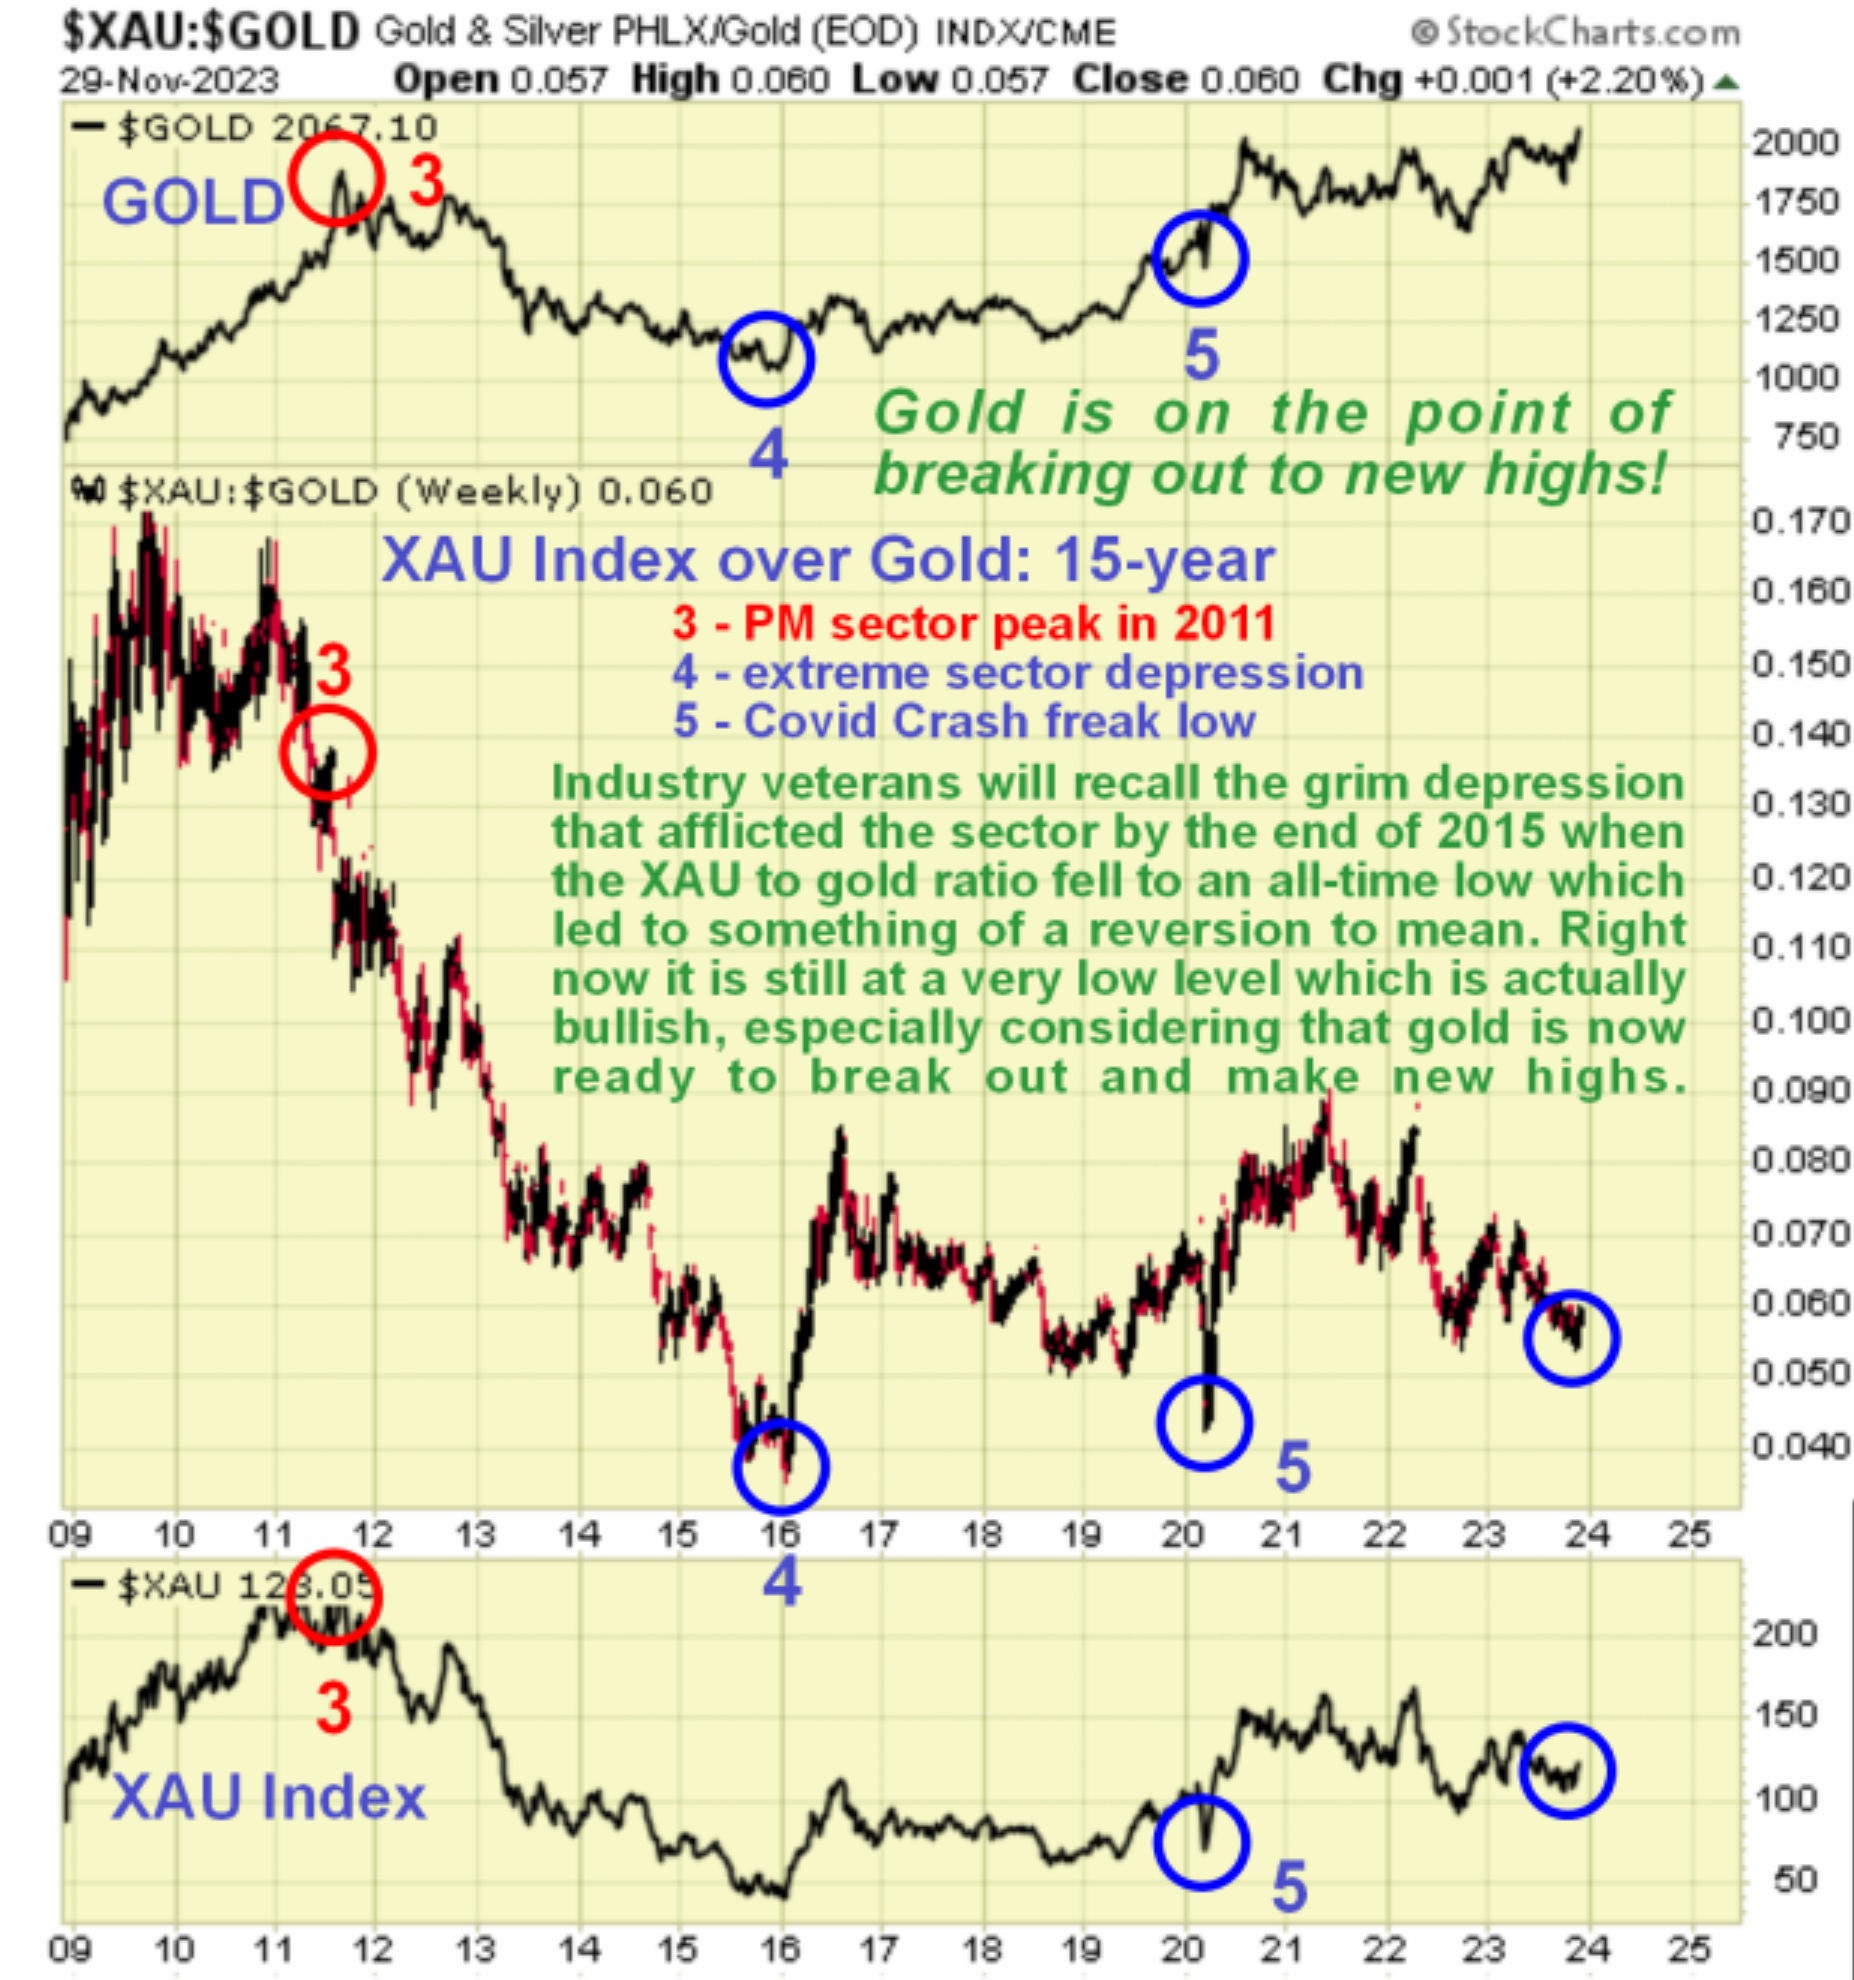
Zooming in now via a 15-year XAU index to gold chart enables us to review more recent years more comfortably. On this chart we see that, if you ignore the freak Covid Crash low of March 2020 when media induced paranoia was at its zenith and oil briefly became worthless, then the only times the ratio dropped below the current low was at the time of the extreme sector depression of late 2015 – early 2016 and then in late 2018 and mid-2019 when it was below the current level but not by much. So we see that with speculative interest in the sector still at extremely low levels and gold on the verge of breaking out to new highs to start a potentially explosive uptrend, the setup for PM stocks could scarcely be more bullish.
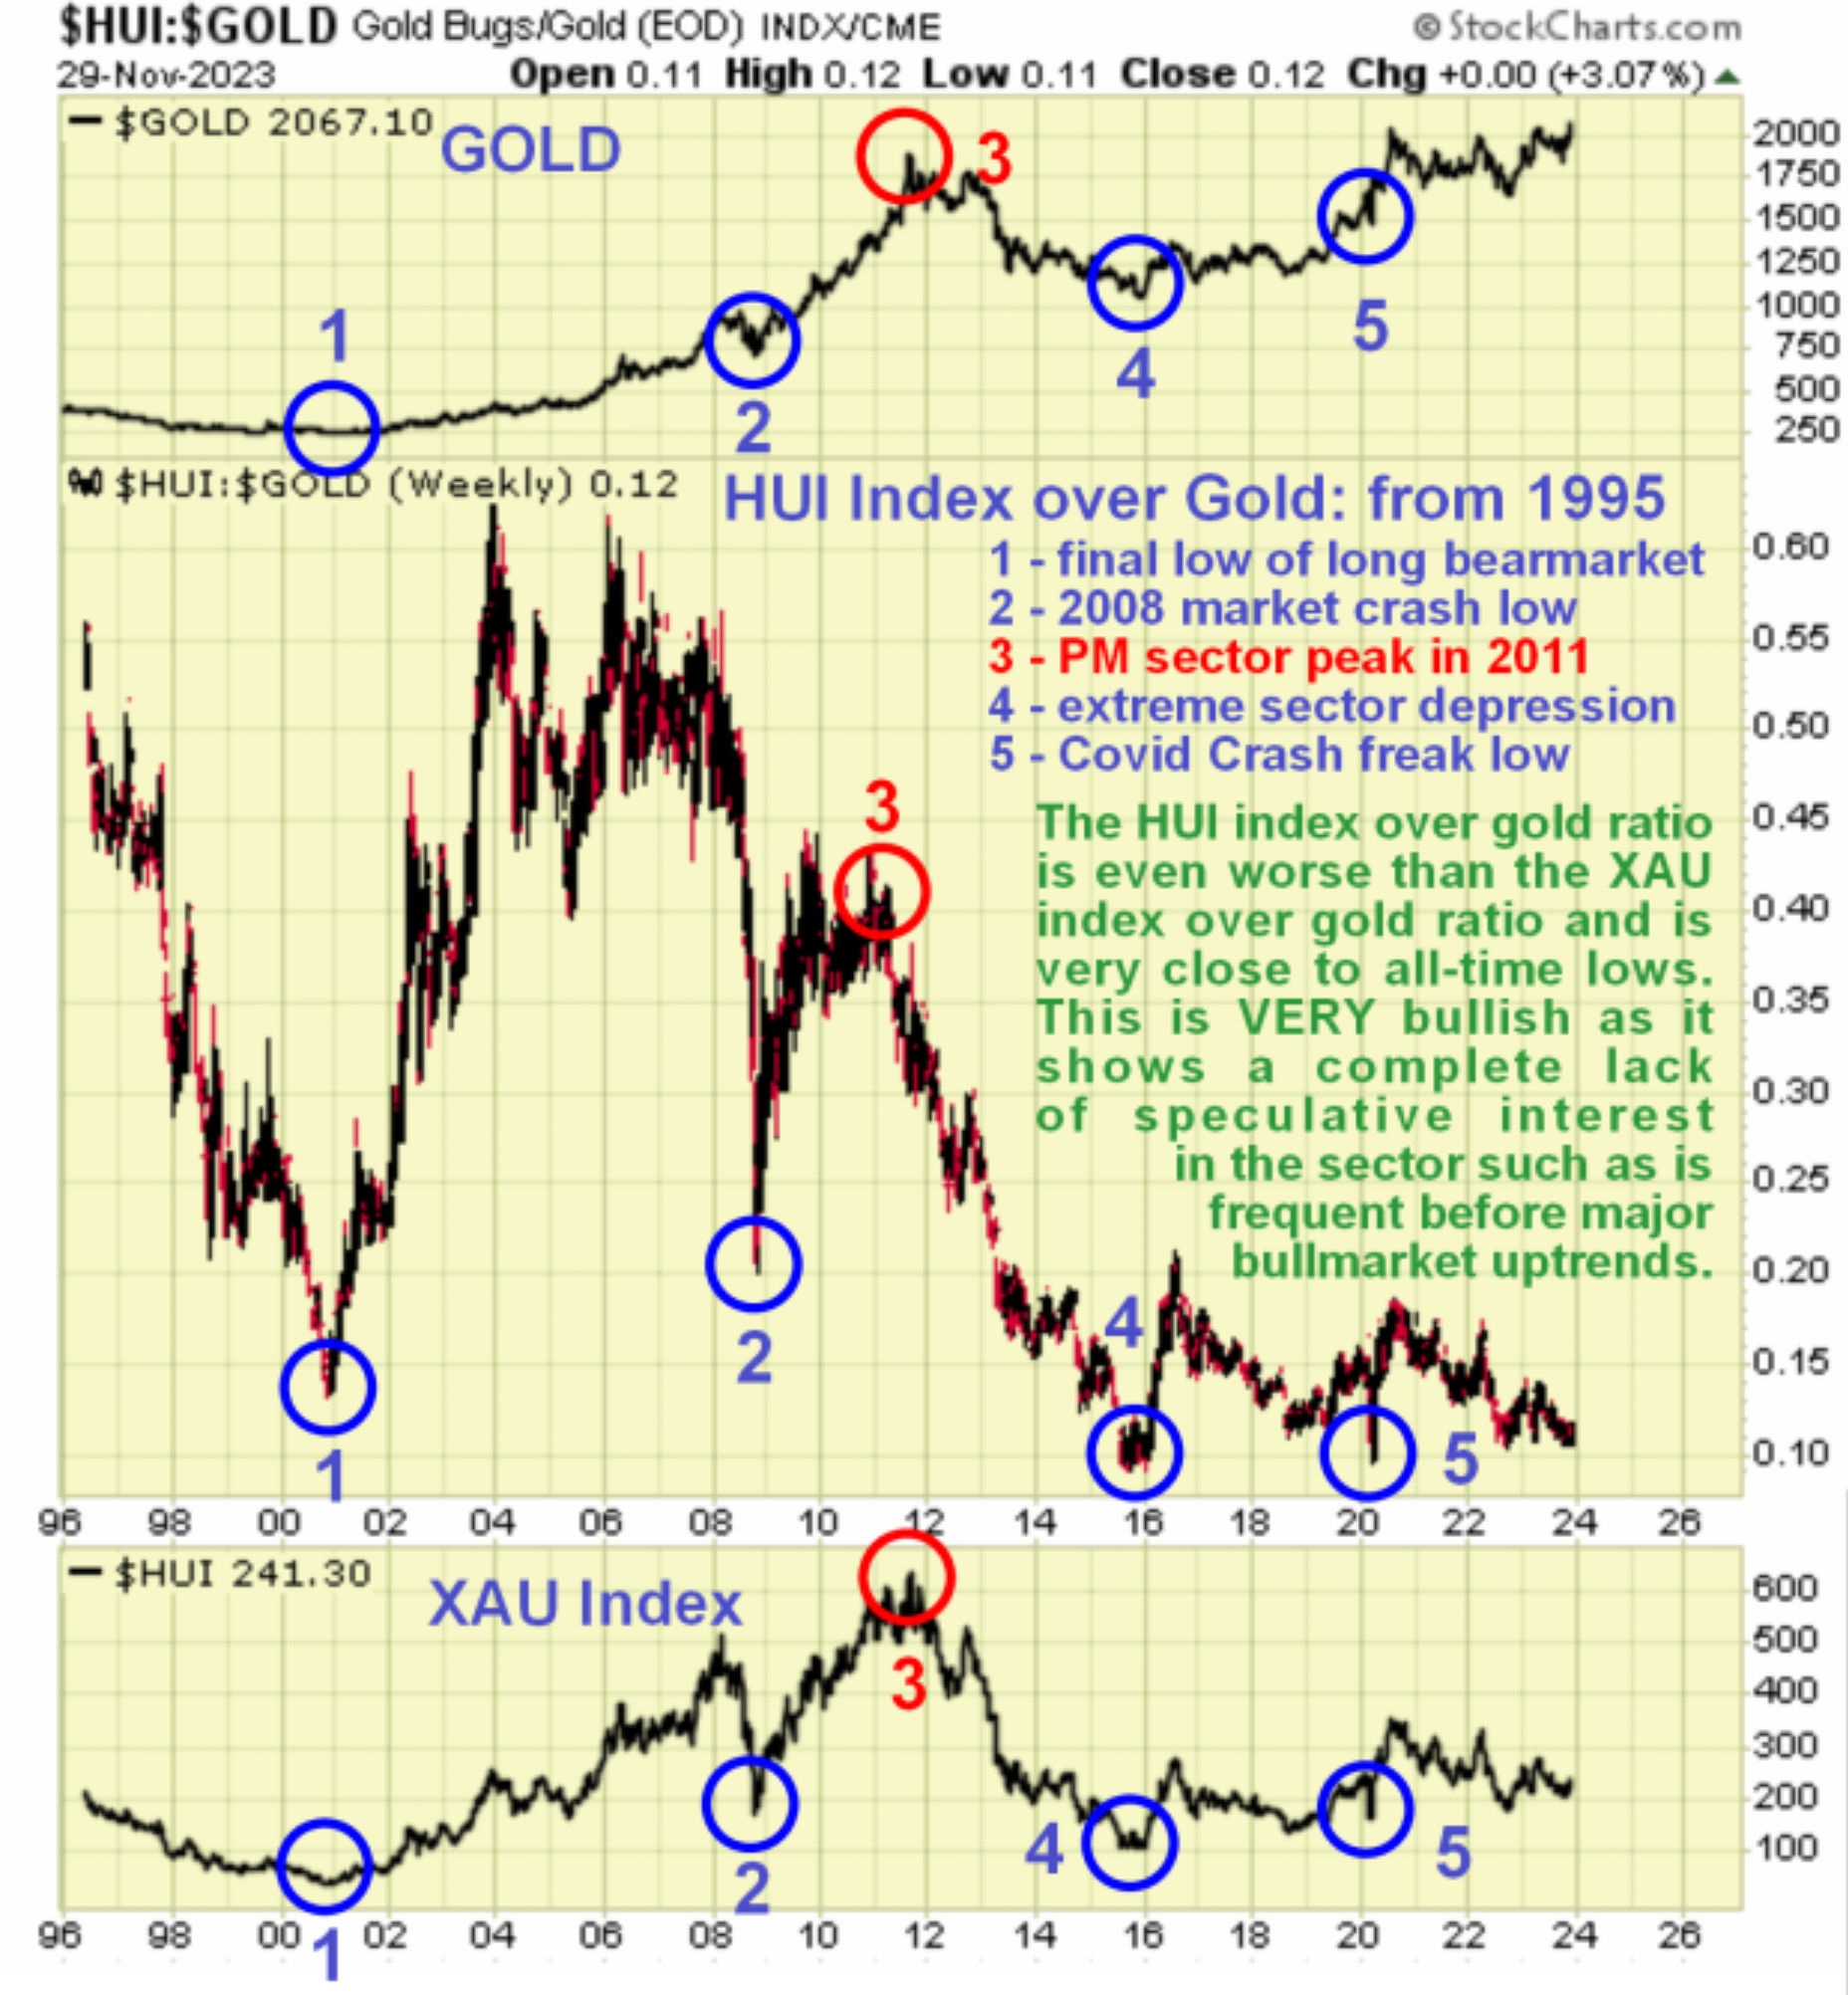
Now we will briefly consider the long-term HUI index to gold charts, briefly because the highs and lows circled correspond with those shown on the XAU index charts so there is no point in me repeating myself. The big point to note on these charts, in addition to what we have observed above, is that as the HUI index includes more companies with lower capitalization which are thus somewhat more speculative, we are likely to see even lower readings for this ratio than with the XAU index where speculative interest is at at low ebb and close to absent and you can see for yourself on these charts, which require no further commentary, that that is indeed the case now.
The conclusion is that these ratio charts could scarcely look more bullish for the Precious Metals sector than they do now and this being the case it is perfectly in order for us to be raving bullish on the sector now and since it is a fact that the large cap gold stocks lead the sector higher during the early stages of a major bullmarket, these are the ones to concentrate on during its early stages also because they are safer and often pay a dividend, and that is the reason we have looked at a range of them in the recent past.
********

Clive P. Maund’s interest in markets started when, as an aimless youth searching for direction in his mid-20’s, he inherited some money. Unfortunately it was not enough to live a utopian lifestyle as a playboy or retire very young. Therefore on the advice of his brother, he bought a load of British Petroleum stock, which promptly went up 20% in the space of a few weeks. Clive sold them at the top…which really fired his imagination. The prospect of being able to buy securities and sell them later at a higher price, and make money for doing little or no work was most attractive – and so the quest began, especially as he had been further stoked up by watching from the sidelines with a mixture of fascination and envy as fortunes were made in the roaring gold and silver bull market of the late 70’s.
Clive furthered his education in Technical Analysis or charting by ordering various good books from the US and by applying what he learned at work on an everyday basis. He also obtained the UK Society of Technical Analysts’ Diploma.
The years following 2005 saw the boom phase of the Gold and Silver bull market, until they peaked in late 2011. While there is ongoing debate about whether that was the final high, it is not believed to be because of the continuing global debasement of fiat currency. The bear market since 2011 is viewed as being very similar to the 2-year reaction in the mid-70’s, which was preceded by a powerful advance and was followed by a gigantic parabolic price ramp. Moreover, Precious Metals should come back into their own when the various asset bubbles elsewhere burst, which looks set to happen anytime soon.
Visit Clive at his website: CliveMaund.com
More from Gold-Eagle


