Gold Heading into Mid-Term Bottom
 share
share
 share
share
 share
share
 share
share
 share
share
 Recapping Last week
Last week's trading saw Gold peaking on Wednesday's fed day, with the metal pushing up to a high of 1696.90. From there, a drop back to lower lows for the swing was seen into late-week, with the metal hitting a Friday bottom of 1646.60 - before bouncing slightly off the same into the daily/weekly close.
Gold, Short-Term
As per the notes from recent articles, the downward phase of the 10, 20 and 34-day cycles was deemed to be in force - with the next low of short-term significance expected to come from the 20 and 34-day waves.
The chart below shows the 34-day cycle in Gold:
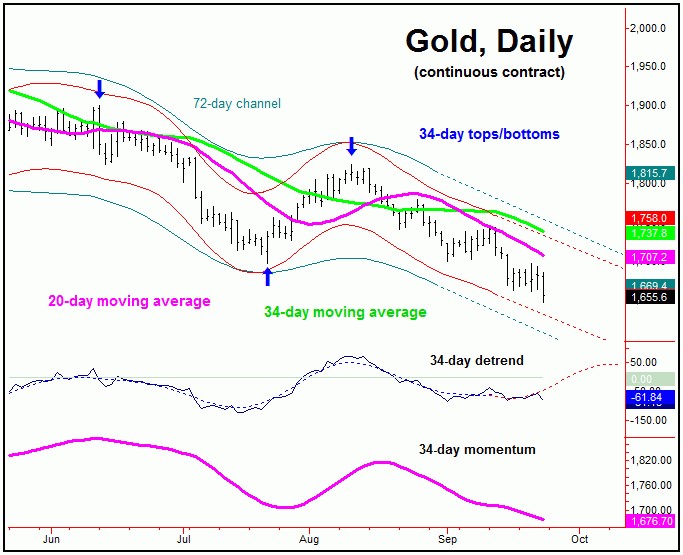
With the drop back to lower lows for the swing into late last week, the downward phase of this 34-day cycle is still deemed to be in force, with the same now at some 46 trading days along - and with that is well into extended territory.
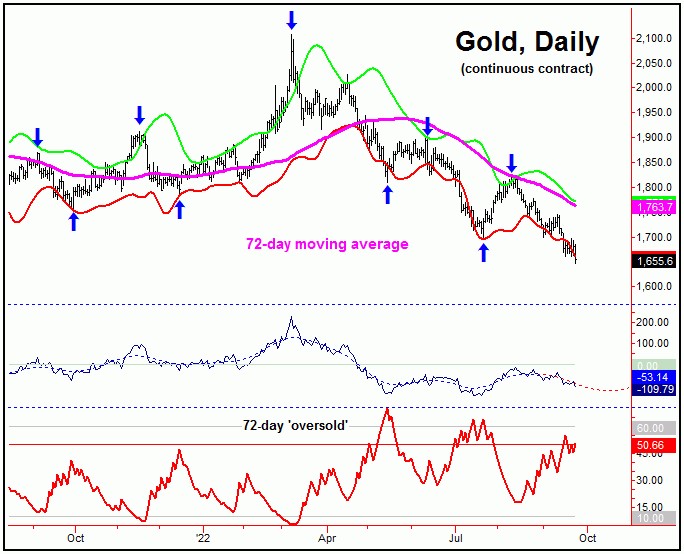
Going further with the above, we have found an extended cycle can and will often end up bottoming the wave of the next larger degree, which - here - is our 72-day cycle component, shown on the next chart:
As mentioned in recent articles, the ideal path for the short-term view was for a rally to be seen with the 34-day cycle, one that ended up as countertrend - due to the position of the larger 72-day wave. So far, that 34-day cycle rally has yet to materialize, with the extended rotation now offering up the potential for a drop on down into our next mid-term low with the larger-degree waves.
Gold, Mid-Term View
For the mid-term picture, the next low of significance should come from the 72 and 310-day cycles for Gold, the combination of which has been projected to trough into around mid-October of this year.
In terms of technical action, we are focusing on our 72-day 'oversold' indicator, shown on our 72-day chart. When this indicator is able to spike above its upper (gray) reference line, this cycle - and thus the Gold market - is usually near a key low. On our chart, we are not quite there yet - but are getting very close.
Stepping back, the next low for our 72-day wave is favored to end up as the trough for the larger 310-day cycle, which is shown again on our next chart:
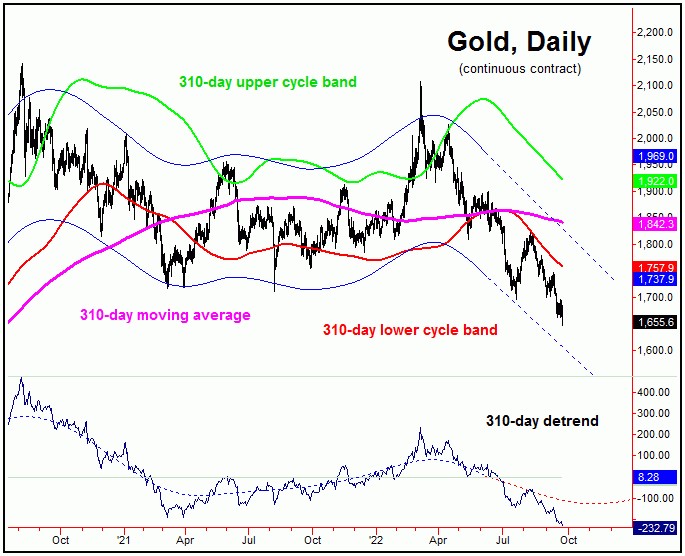
In terms of price, I mentioned in prior articles the potential for a drop down to the 1650's for Gold as these 72 and 310-day cycles bottomed out - an action which has now been met with the decline into last week.
Having said the above, with the low for the 72 and 310-day waves not actually due until mid-October (plus or minus), there is the actually potential for a spike on down to the 1580-1600 region as these waves next trough, valid as long as the 1754.80 figure (December, 2022 contract) is able to hold any strength in-between.
Gold's Bigger Picture
From whatever bottom that does form the 72 and 310-day waves in the coming weeks, as mentioned in prior articles the probabilities will favor a sharp rally of some 20-25% or more playing out in the months to follow - with the upper 310 cycle band (in green) acting as the ideal and eventual upside price magnet. In terms of time, our ideal path is looking for that rally to play out into the Spring of next year, before looking for another peak with the 310-day cycle component
Jim Curry
The Gold Wave Trader
http://goldwavetrader.com/
http://cyclewave.homestead.com/
********
share
share
share
share
share
More from Gold-Eagle


