Gold Major Cycle Bottom Coming Due


Last week's trading saw both the high and the week registered in Monday's session, with the high coming in at the 1574.80 figure - before dropping sharply down to a intraday session low of 1450.10. From there, a basic sideways consolidation was seen for the balance of the week, but with the metal ending down approximately 32 points from the prior Friday.
Gold Crashing Lower
With the action seen in recent weeks, gold has witnessed a decline of over 250 points from peak to trough - which is a major correction for the metal, though one not totally unexpected, due to the configuration of the various time cycles that we track, which correctly forecast the recent drop.
Normally, in times of crisis or panic - such as we are currently in (with the COVID-19 virus fears) - we would expect to see rising gold prices. Here, the metal is being sold, as folks scramble to come up with cash to pay equity margin calls, and to raise extra cash for normal everyday life in this unknown market environment.
A similar pattern was seen from March of 2008 into October of 2008, where gold declined along with stock prices. However, about 3/4 of the way into the same, gold eventually bottomed-out - turning sharply higher for several years, before eventually topping in September of 2011, well over doubling in price during that timeframe.
Gold, Short-Term Picture
With the above said and noted, we need to take a look at what the cycles are saying about the current market environment. Short-term, the 10-day cycle is still dominating the action, with that cycle shown again below:
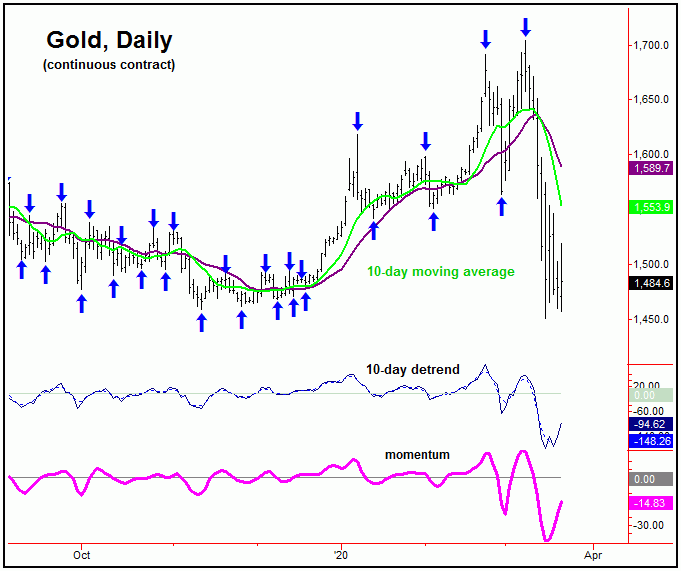
In terms of time, our last projected trough for this 10-day cycle was set for March 16th, plus or minus a day, with that low coming in right on Monday, March 16th. So far, the action seen since has been more sideways-to-up, with its next short-term peak due to materialize at anytime.
Until proven otherwise, however, the current upward phase of this 10-day cycle is favored to end up as a countertrend affair. If correct, then the probabilities will favor another drop back to or below the lows again on the next swing down, then to be on the technical lookout for the next semi-important trough - expected to come from the combination of the larger 34-day and 72-day cycles.
Here is the smaller 34-day component, shown on the following chart:
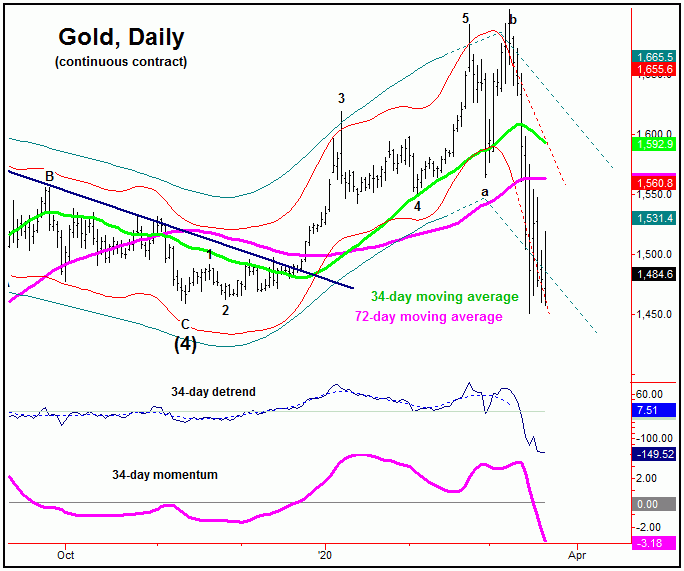
With the configuration of this 34-day component, lower lows in the days ahead - if seen as expected - should be primed to bottom this wave, for what is anticipated to be a good-looking short-term rally in the days/weeks to follow - likely playing out well into the month of May.
In terms of price, the minimum rally following the next 34-day bottom should see the 34-day moving average acting as the magnet. Having said that, due to the action seen into last week, I am going to now favor the next rally phase of this wave to end up as countertrend, to be followed by lower lows on the next swing down - which would be the odds-on favorite to end up as our next mid-term trough.
Gold Mid-Term View
Stepping back, the strength of the most recent decline now suggests that our larger 154-day cycle topped with the 1704.40 swing high. This is simply due to the sharp break below the lower 154-day channel line - as well as the fact that the November, 2019 swing low was taken out to the downside. Take a look at our next chart:
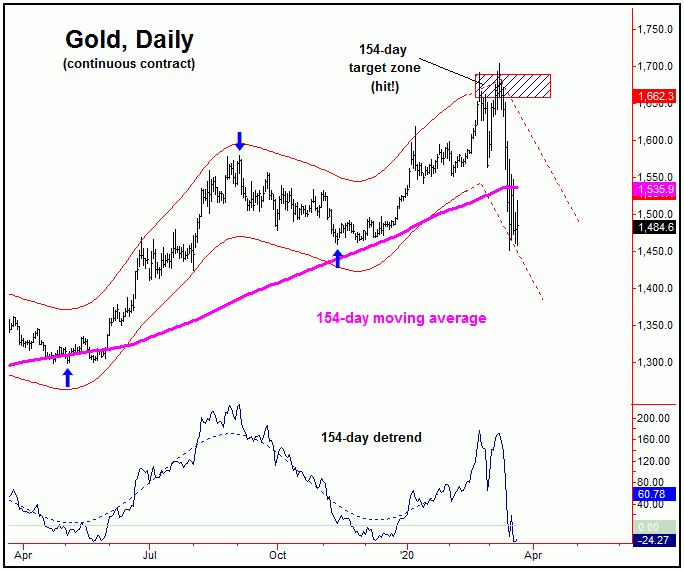
With the above said and noted, the next mid-term trough should now come from this 154-day component. Once this bottom is complete, the following rally phase should be a spectacular event, a multi-month rally which is expected to be the largest percentage rally of the year. More precise details of when this bottom is favored to come are noted in our thrice-weekly Gold Wave Trader market report.
Gold, Bigger Picture
For the stepped-back view, the next mid-term upward phase (with the 154-day cycle) is the one expected to top the largest wave that we track for gold, the four-year component, shown again on the chart below:
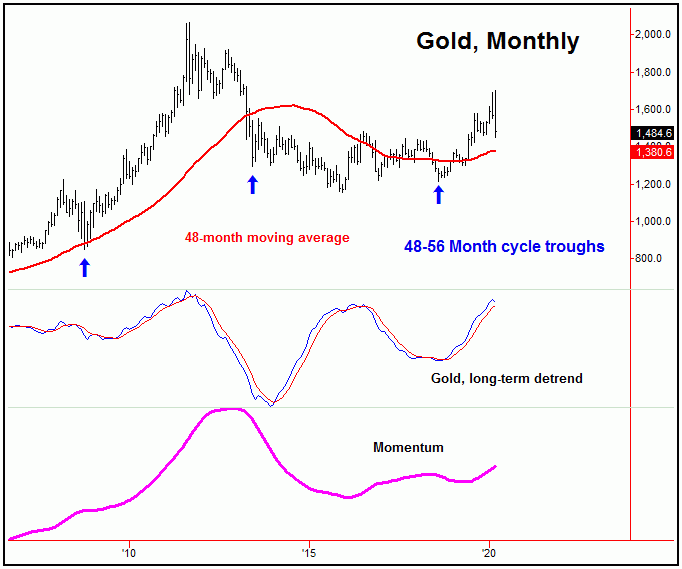
Until proven otherwise, as mentioned in past weeks this four-year cycle is deemed to be pointing higher into later this year, a move which should form a more important price peak for gold. From whatever high that does form this component, gold should see a sharp decline - one which eventually takes the metal back to its rising 48-month moving average, though that move would be expected to end up as countertrend, holding at or well above the August, 2018 trough - its last labeled low.
U.S. Stock Market Update
From the comments made in recent articles, the U.S. stock market was seen as being in a 'bottomless pit' - though is now coming due again for a short-term bottom, due to the configuration of the most dominant short-term cycle. Take a look:
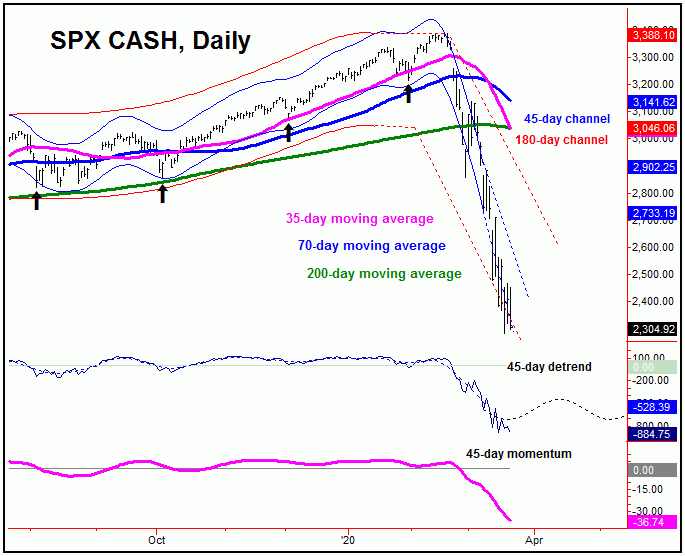
The chart above shows the 45-day cycle, which the detrend indicator shows is moving into bottoming territory. Having said that, in bearish markets, bottoms can often come later than expected - with the next key date of interest being March 30th, plus or minus a day, which our next 'reversal' date for the SPX. Could this date end up troughing this wave? Time will obviously tell.
Stepping back slightly, once the next trough does form for this 45-day component, the probabilities will favor a very sharp rally into the month of April - but one which is expected to be short-lived, and a countertrend affair. This is due again to the mid-term cycles that we track, the combination of which are pointing lower into at least the month of May, but, potentially, will be pushing down into the June - July timeframe.
For the bigger picture, from our next mid-term low on the SPX, we are expecting the largest percentage rally of the year to take hold - one which is likely to be 40% or more off of whatever bottom that forms, and lasting into later this year. More on this in the coming weeks, as the action continues to unfold.
Jim Curry
The Gold Wave Trader
http://goldwavetrader.com/
http://cyclewave.homestead.com/


